Market Recap for Monday, August 8, 2016
It's summer time in the stock market, but you wouldn't know it by the action since June 27th. There's no doubt the rally has been strong, but most of the gains have occurred during the more bullish June 27th to July 17th period where the S&P 500 rose from 2000 to 2161 (approximately 8%) while the bearish July 17th to September 27th period is currently higher by just 19 points, or less than 1%. I'm not saying the stock market is poised to tumble, just keeping it real. I've provided more historical facts about this current bearish summertime period below in the Historical Tendencies section.
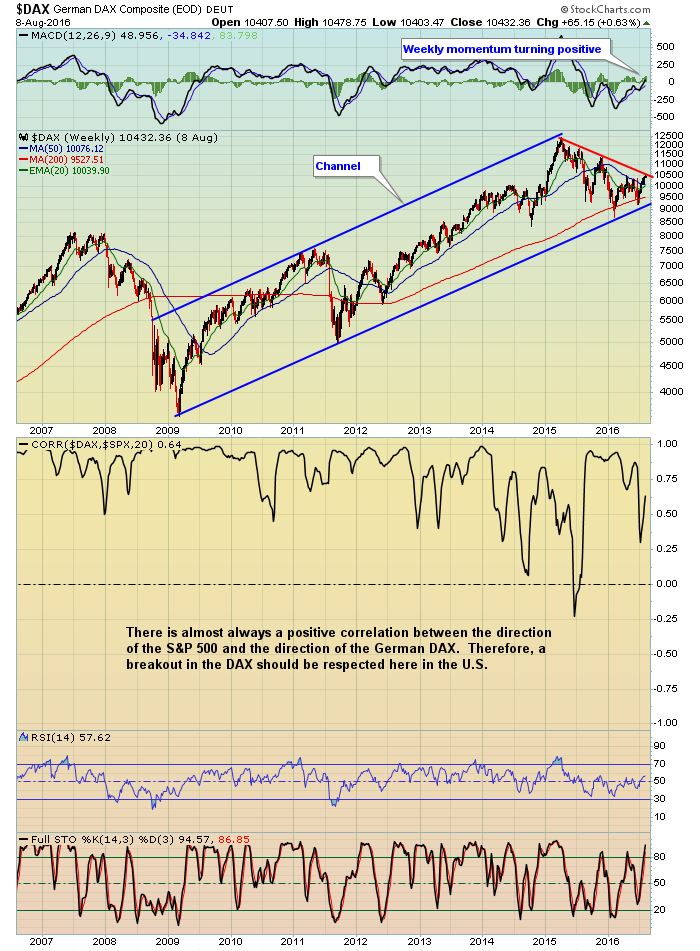
Action on Monday was quite boring in most respects with little change in our major indices. The German DAX broke above key price resistance at 10457 intraday on Monday, but failed to hold on into the close, finishing at 10432. In early trading Tuesday, however, the DAX has climbed above 10500. This is noteworthy and should be watched closely as the stock market ties between Germany and the U.S. are quite clear in the following chart:
 Despite the lackluster action on Monday, energy (XLE, +1.33%) managed to post strong gains as crude oil ($WTIC) rallied nearly 3% to $43 per barrel. On the flip side, healthcare (XLV, -0.85%) was the laggard, dragged down by a weak pharmaceutical area. I'm featuring the pharmas in the Sector/Industry Watch section below.
Pre-Market Action
There's not a whole lot going on right now in terms of economic or earnings news. Walt Disney (DIS) will report after the close today with consensus estimates looking for 1.61 per share in EPS.
Crude oil ($WTIC) is ticking slightly higher this morning, hoping to keep the rally alive in energy. The German DAX is threatening a major breakout above 10500 and that would bode well for U.S. stocks. Overnight, Asian markets were mixed.
Current Outlook
If you're waiting and waiting for the market to turn lower, you're not alone. Marc Faber, editor of the Gloom, Boom and Doom report, was back on CNBC yesterday, once again calling for a crash. This is the same guy that was on CNBC in October 2009, calling for a crash when the S&P 500 had rallied to 1100. We're nearly 100% higher and he hasn't changed his tune a bit. That's nearly seven years later and 1100 points higher and he's still making the exact same bearish call. How do people like that remain on CNBC? It's simple. CNBC loves to stir up fear to sell ads and improve ratings. Fear sells, it's as simple as that. They LOVE the jarring headlines.
Thanks for nothing, Marc. You're worse than a broken clock. It doesn't take seven years to figure out your clock doesn't work.
As for REALITY, the longer-term picture cannot turn bearish until the short-term picture does - at a minimum. Therefore, let's look at the current 60 minute chart of the NASDAQ and identify key areas of support to watch:
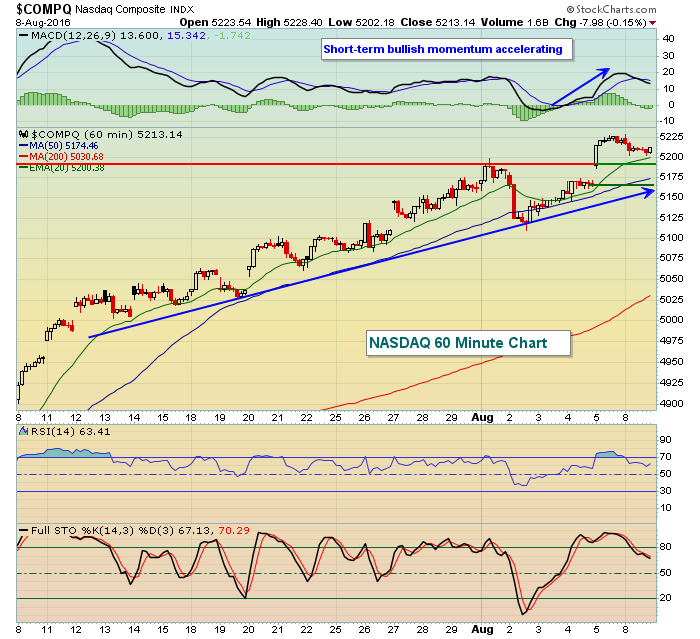 Short-term momentum is strong, so initial support should be the rising 20 hour EMA and that's at 5200. It's unrealistic to assume the NASDAQ will continue to trade above its rising 20 hour EMA, so the other short-term levels to watch are the top and bottom of gap support, the rising 50 hour SMA and trendline support. That "range" is roughly from 5150-5200. Should that range fail to hold, then we'll look to the intermediate-term daily chart for a wider view. In the meantime, it's hard to short anything.
Sector/Industry Watch
The Dow Jones U.S. Pharmaceuticals Index ($DJUSPR) appears to be working off a negative divergence that printed on its most recent high. The good news is that key 50 day SMA is rapidly approaching and that, combined with price support, is likely to slow or stop the recent profit taking binge. Here's the chart:
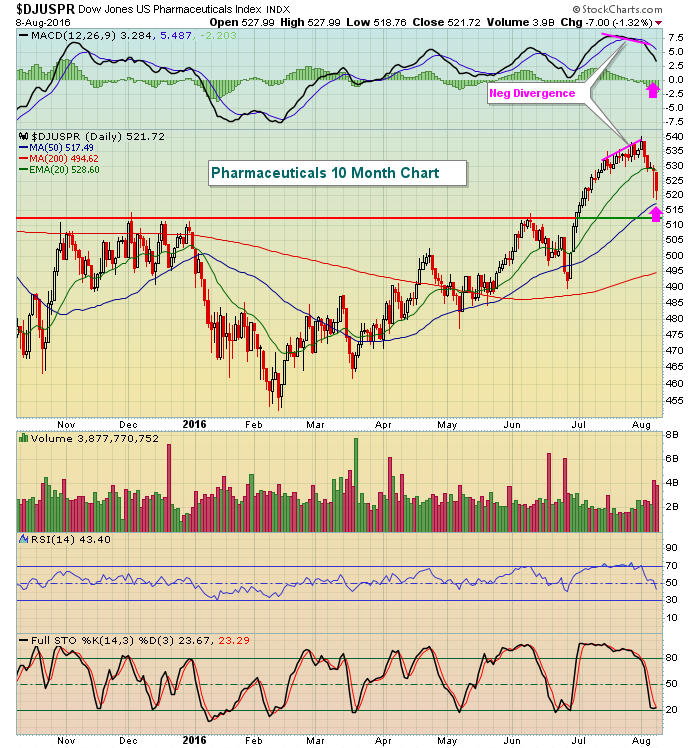 The pink arrows mark the areas I look to be tested following a negative divergence, namely the MACD centerline and the 50 day SMA. Monday's lows are approaching both. Given that the RSI has now dropped back to 43, this group's reward to risk on the long side is gaining appeal.
Historical Tendencies
I've discussed in the past how the July 17th close to September 27th close has produced much lower than average returns since 1950 on the S&P 500. Here are the numbers:
Annualized return: -2.55%
No. of up days: 1694
No. of down days: 1561
Total no. of trading days: 3255
Equivalent no. of trading years: 12.87
That's a lot of history - nearly 13 years worth of daily S&P 500 data. Note, however, that there have been more up days than down days. So the point here is not that we should expect action to the downside every day. Rather, the "tendency" is for the stock market to struggle during the summer months. While 2016 summer action has been solid, September 27th hasn't arrived yet so we'll see what the market has in store for us over the next seven weeks.
Key Earnings Reports
(actual vs. estimate):
COH: 45 vs .40
JEC: .78 vs .74
LAMR: 1.37 vs 1.24
PPL: .56 vs .53
RRGB: .75 vs .79
STE: .79 vs .78
VRX: 1.40 vs 1.59
(reports after close, estimate provided):
DIS: 1.61
MYL: 1.15
Key Economic Reports
Q2 productivity released at 8:30am EST: (actual) vs. +0.5% (estimate)
June wholesale inventories to be released at 10:00am EST: (actual) vs. +0.2% (estimate)
Happy trading!
Tom


