Market Recap for Friday, August 19, 2016
Stocks ended last week on a negative note with each of our major indices finishing in negative territory. Losses were very minor on the more aggressive NASDAQ and Russell 2000, however, and three sectors - materials (XLB, +0.14%), technology (XLK, +0.06%) and consumer discretionary (XLY, +0.06%) did manage to finish with gains. Utilities (XLU, -1.22%) and energy (XLE, -0.83%) were the two primary laggards, but the XLE had an excuse after making a big breakout on Friday. We could see further profit taking today as crude oil trades considerably lower in early action this morning.
Semiconductors ($DJUSSC) were one of the leaders on Friday, but there is still a negative divergence in play that could haunt the group in the very near-term. The good news is that Friday's fresh new high occurred with increasing volume. Strong price action with solid volume trumps signs of slowing price momentum (MACD negative divergence), although I'd be wary of a reversing candle in this group. Check out the current chart:
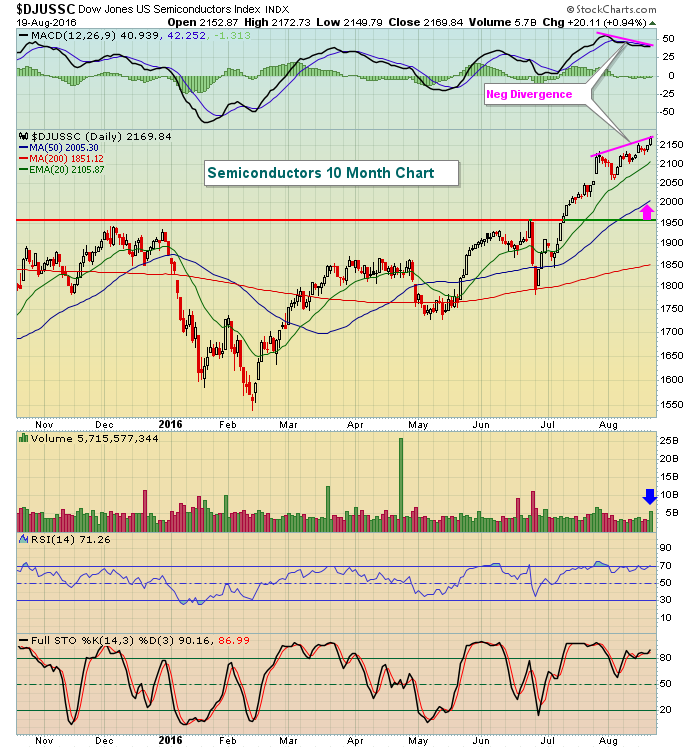 The pink arrow marks a potential upcoming test of the rising 50 day SMA, while the blue arrow highlights the increasing volume that we saw on Friday. There'll be a battle here, but if the slowing momentum results in a sudden downward turn in the DJUSSC, the S&P 500 will be more likely to sell off as well.
Pre-Market Action
It's a very light day in terms of earnings and economic news as we begin a fresh trading week. Asia was mixed overnight while European indices are mostly lower with crude oil prices ($WTIC) down nearly 3% in pre-market trading. Germany's DAX has pulled back to test key price support in the 10450-10500 range. If that index cannot manage to hang onto support, it would open the door to more selling in the U.S. Here's the latest look in Germany:
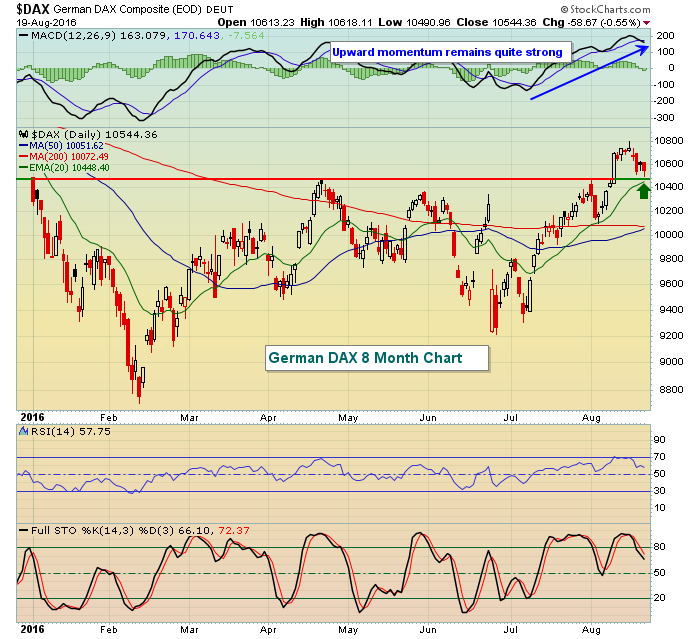 The DAX was short-term overbought, as evidenced by its RSI at 70 for a week and its stochastic remaining above 90 during that same period. This morning, the DAX is down 68 points to 10475 at 8:30am EST. How this index finishes could provide a few clues as to what we might expect from the S&P 500 later in the session after what appears to be an upcoming weak open.
Current Outlook
Seasonality could play a role in the very near-term as the S&P 500's annualized return from the 19th to 27th of all calendar months is -2.73%. That may not seem like a big deal, but consider two things. First, the average annual return on the S&P 500 is roughly 9% since 1950. So the return during this period is nearly 12 percentage points below normal. Second, this 9 day period within each month has totaled more than 5400 trading days over the past 66 calendar years. This translates into more than 21 years worth of data. So imagine investing in the stock market for 21 years and averaging a 2.73% loss every year. That might be a little frustrating!
Sector/Industry Watch
One of last week's strongest industry groups was footwear ($DJUSFT), which rose 4%. Before we look at the chart for the group, keep in mind that September is the strongest month of the year for Nike (NKE) over the past five, ten and twenty year periods. Over the last twenty years, NKE has gained an average of 6.8% during the month of September (perhaps back to school?). So we know that seasonality already favors one key component of the group. Skechers (SKX) is an exception as SKX tends to perform much better early in the calendar year. Now let's look at the technical setup for the DJUSFT:
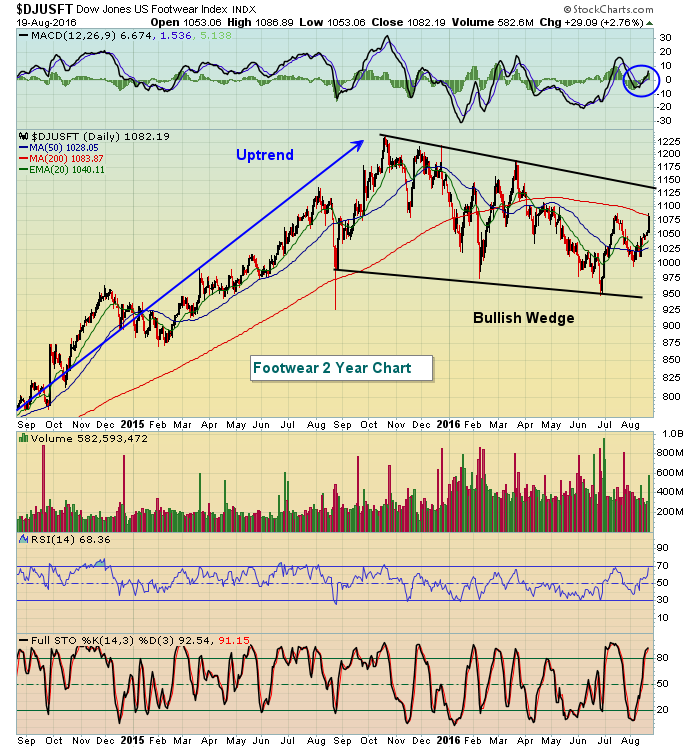 Footwear remains in a bullish pattern, consolidating its strong prior gains that ended in September 2015 with a bulish wedge pattern. A traditionally strong September could be the catalyst to break this wedge to the upside. Therefore, a late August pullback could be an opportunity to enter the space, particularly NKE, which is one of the strongest September performers.
Monday Stock Setup
Every Monday, I take a look at one stock setup for the week here in this space. I actually provide 3-4 setups typically, but discuss those in my 1pm Trading Places LIVE webinar. If you're interested in reviewing all of these setups, you can join me in my webinar by REGISTERING HERE.
As for this week, the following stock looks like a solid trading candidate:
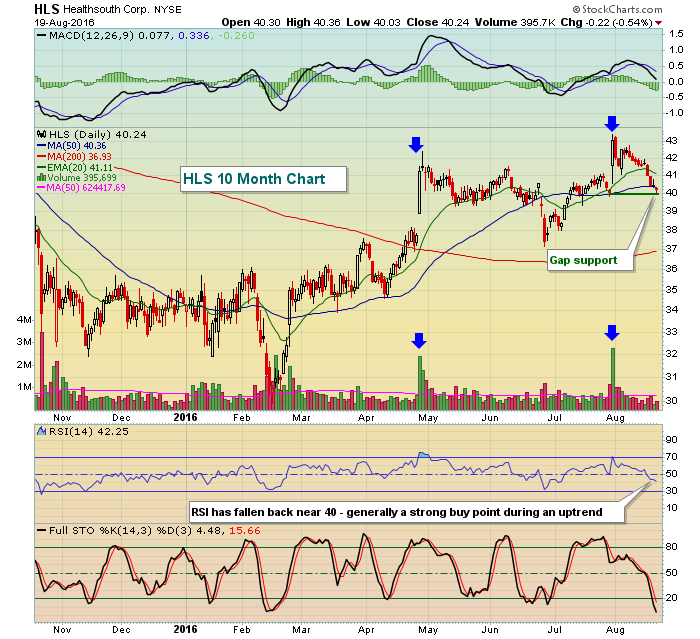 The last two earnings-related gaps higher have occurred on very heavy volume. HLS has seen recent profit taking push the stock all the way back to gap support, where I'd look for a rebound. A close below 39 could be problematic while I'd consider a target of 43.00. I'll discuss HLS and other setups later in today's webinar.
Historical Tendencies
Mondays are by far the most bearish day of the week. Over the past 66 years on the S&P 500, Mondays have produced annualized returns of -15%, which is 24 percentage points below the 9% average enjoyed throughout those years. But worse yet are Mondays that fall between the 18th and 27th of calendar months. Today is Monday, August 22nd. We'll see if history repeats.
Key Earnings Reports
None
Key Economic Reports
None
Happy trading!
Tom


