Market Recap for Thursday, August 18, 2016
Energy (XLE, +2.06%) led the action on Thursday and helped turn the stock market around after it briefly turned negative at mid-day. Utilities (XLU, +1.23%) and materials (XLB, +0.64%) also performed well, but the remaining six sectors fluctuated near the flat line with financials (XLF, -.08%) and consumer discretionary (XLY, -.06%) the worst performers and in negative territory. REITs were mostly weak with the Dow Jones U.S. Specialty REITs ($DJUSSR) falling back to test price support from June. This group has lost its 20 day EMA, 50 day SMA and rising trendline support, so if price support fails, it'd be a group I avoid. Check it out:
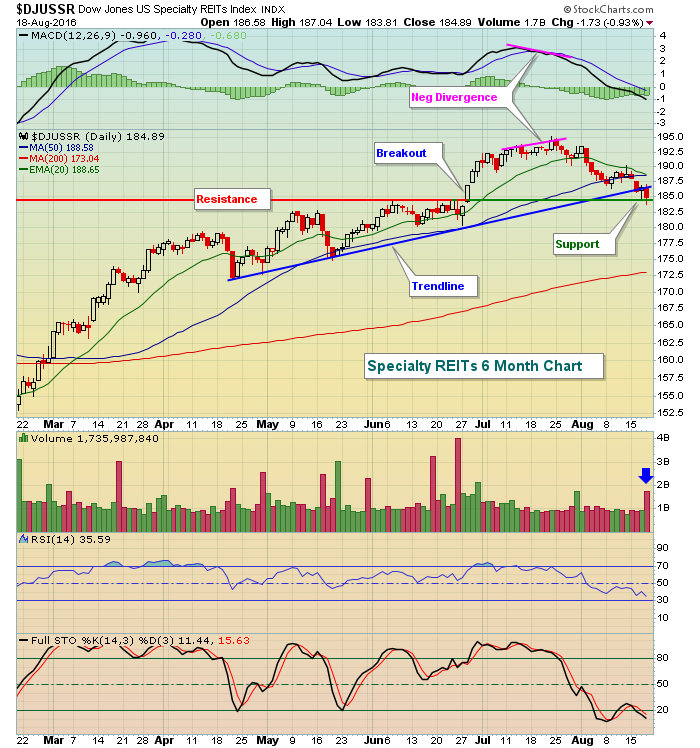 Volume escalated on the REITs selling yesterday and just about every technical sign has turned negative - except that price support has not been lost. If that goes, be very careful here. A reversing candle here, however, could mark a bottom so we're at a critical juncture.
Back to energy. Crude oil ($WTIC) spiked nearly 3% again on Thursday to $48 per barrel. Neckline resistance in the $50-$52 per barrel range is closing in. But the uptrend in crude oil is all that was necessary to encourage traders to jump on the back of energy shares. Take a look at the huge breakout in the XLE:
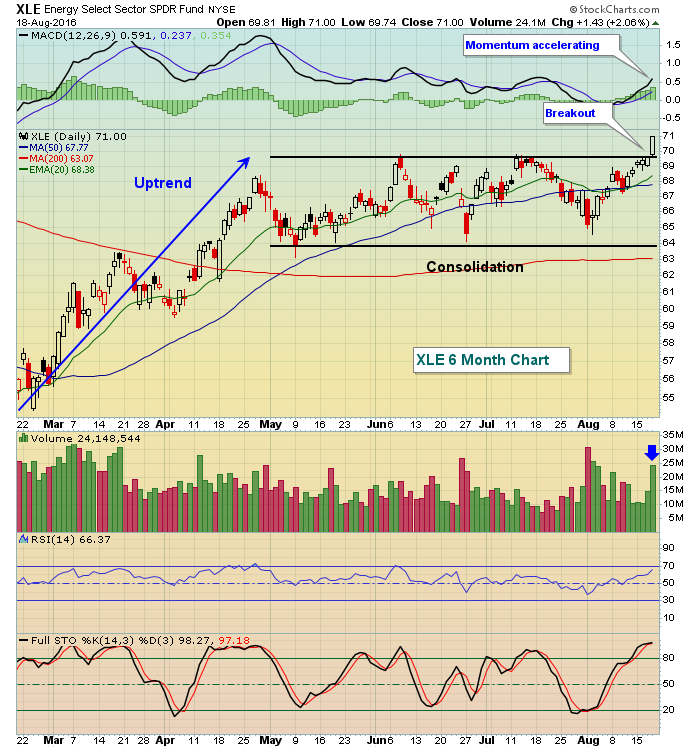 The high volume breakout confirms the bullish pattern that was in play on the XLE. I'd expect to see energy remain a leader in the market over the next few weeks - at a minimum.
Pre-Market Action
Both Deere & Co (DE) and Applied Materials (AMAT) provided solid quarterly results and raised guidance, especially AMAT who reported record orders. That, along with recently rising crude oil prices, are having little impact on futures. The Dow Jones futures are down 45 points with a half hour to go to today's opening bell. Action was mixed overnight in Asia, but it's clearly more negative in Europe with the German DAX down 52 points. It's approaching key price support in the 10450-10500 range. Failure to hold support would put more pressure on the S&P 500, which already appears to be weakening technically.
Current Outlook
We could be seeing the market just beginning to roll over as a five week uptrend line on the NASDAQ has recently been lost. Overbought conditions, negative divergences (on daily chart not shown below) and seasonality also are all playing a role, but it's time to consider taking some profits and watching this for a week or so. Take a look at the NASDAQ two month 60 minute chart:
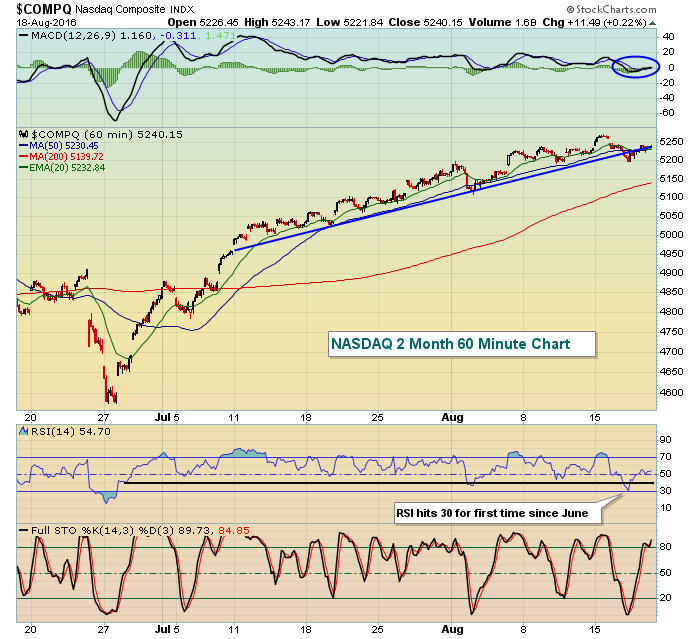 A hallmark of an uptrend is an RSI that remains above 40. You can see above that the hourly RSI has weakened and actually dropped to hit 30 at this week's price low. That's the first time the RSI has touched 30 since late June's swoon. The 60 minute MACD also dropped below centerline support and that's also been a rarity since June. Knowing that the 19th - 25th of calendar months tends to be bearish, let's turn a bit more cautious here and see how today and next week play out.
Sector/Industry Watch
Leading the energy rally yesterday were pipelines. The Dow Jones U.S. Pipelines Index ($DJUSPL) surged more than 4% to clear a significant price hurdle. Take a look:
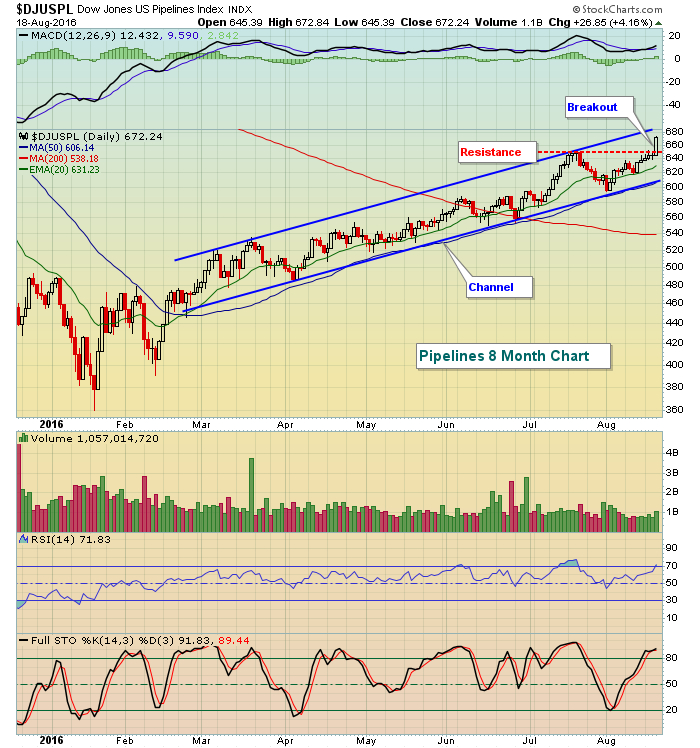 There is a well-defined channel that the DJUSPL has been trading within for several months. Look for a bit more strength before profit taking potentially carries it back to test the area of its breakout. That would represent best reward to risk entry into the group.
Historical Tendencies
Over the past 66 years, the worst day of the calendar month on the S&P 500 has been the 19th. The 19th has produced annualized returns of -34.33% since 1950. Perhaps a bigger problem is that historically five of the next six calendar days also have produced negative annualized returns over that 66 year period. Clearly, this is the worst time of the month for U.S. equities.
Key Earnings Reports
(actual vs. estimate):
BKE: .32 vs .33
DE: 1.55 vs .95
EL: .43 vs .40
FL: .94 vs .91
Key Economic Reports
None
Happy trading!
Tom


