Market Recap for Tuesday, August 16, 2016
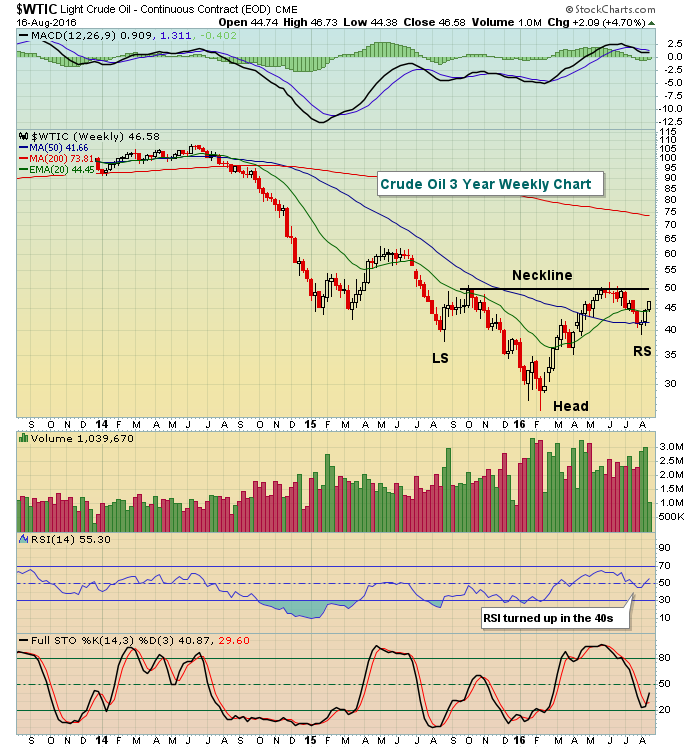
Eight of nine sectors fell on Tuesday with energy (XLE, +0.16%) the lone sector that managed to finish in positive territory. That was attributable to a continuing rise in crude oil prices ($WTIC) that has taken black gold from $39 per barrel two weeks ago to more than $46 per barrel on Tuesday. Crude oil is down very slightly in early action this morning. The potential bottoming reverse head & shoulders pattern in crude oil is still taking shape as follows:
 Utilities (XLU, -1.18%) and healthcare (XLV, -0.89%) were the two weakest sectors on Tuesday with biotechs ($DJUSBT) showing notable weakness. For now, the selling in the DJUSBT appears to be normal profit taking as technical conditions remain strong for a further advance. Here's the latest chart:
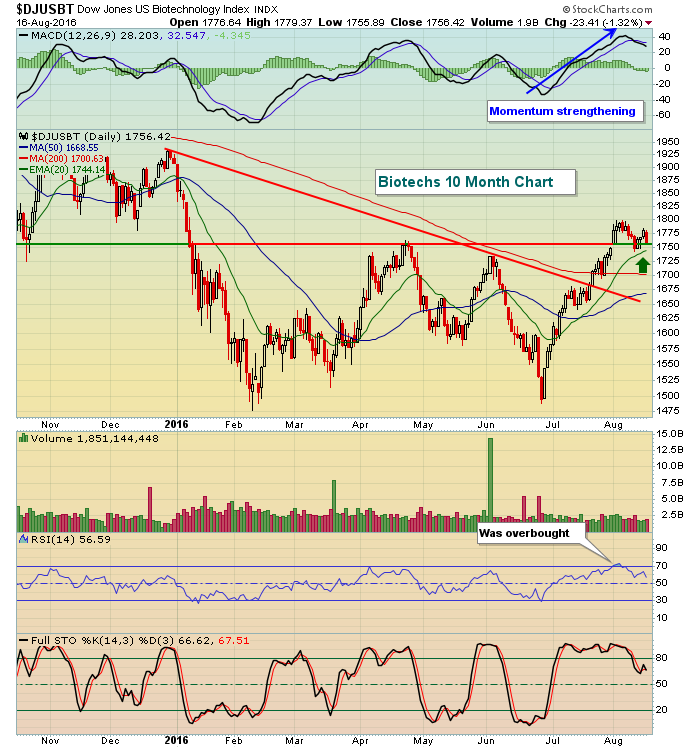 I'd grow more cautious if that rising 20 day EMA failed to hold as closing support. Until then, the selling appears to be nothing more than a normal pullback during a rising trend.
Pre-Market Action
There are no economic reports due out today, although the FOMC minutes will be released at 2pm EST and certainly scrutinized. Cisco Systems (CSCO) reports its latest quarterly results after the bell and should be watched very closely as CSCO remains close to its long-term price resistance. Solid results and increased guidance could be very significant technically for CSCO's longer-term price performance. Check out the current technical state of CSCO:
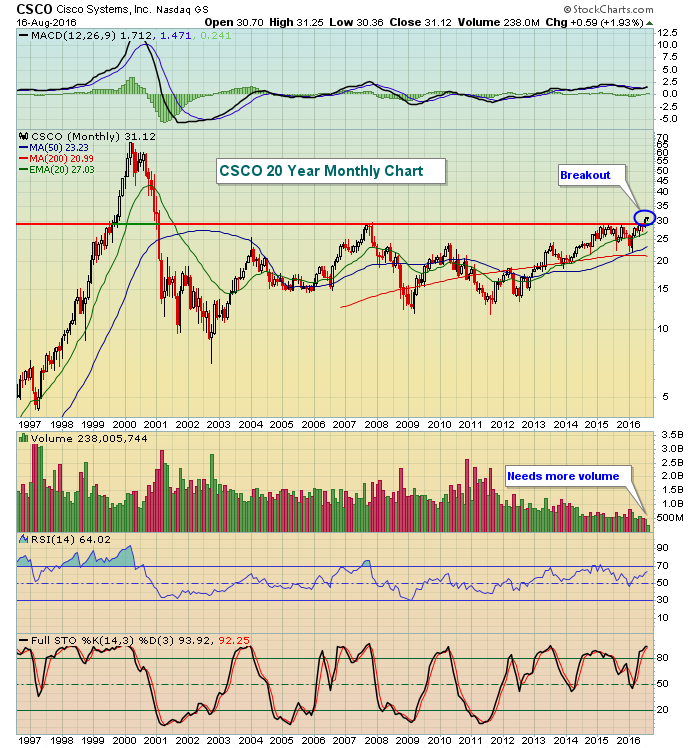 The breakout in CSCO is promising but thus far has come with little volume confirmation. That could change tonight with a blowout quarter so all eyes will be on CSCO after the bell.
U.S. stock futures are relatively flat as traders have turned a bit more cautious after yesterday's bout of selling and ahead of the FOMC minutes. There's been mostly global selling last night in Asia (the Nikkei was the primary exception) and this morning in Europe. The German DAX is down more than 1% but currently remains above 10450-10500 price support. I'd like to see that level hold on any further selling.
Current Outlook
Now that we've seen one day of increased selling, it's a good time to look at where we might go if price action were to continue to deteriorate. Whenever I see a negative divergence, I think two things. First, I think there's distinct possibility of a MACD centerline "reset" (a reset simply starts the momentum game over again at the zero line). Slowing momentum tells me to look for a possible reset. The second possibility is a 50 period SMA test or, in this case, a 50 day SMA test. Through my experience, those are the two probable results after a negative divergence prints. But many times, prices keep rising until the MACD moves to a new high, thereby eliminating the negative divergence. Sooooo....I look for price confirmation to that signal of slowing momentum. Currently, with the S&P 500, that confirmation "signal" would be loss of the support zone from 2170 (20 day EMA) to 2175 (recent price resistance turned price support). Check out the visual:
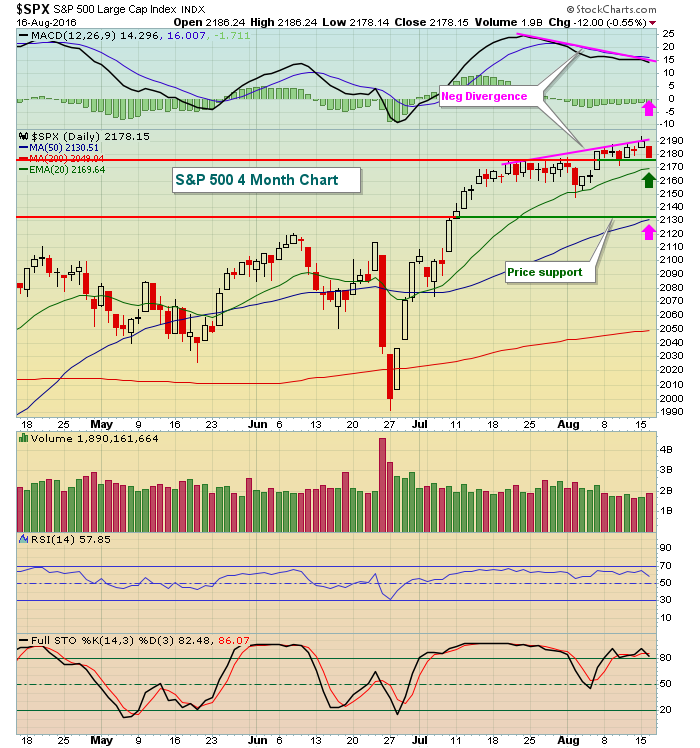 If the 2170-2175 support zone is lost, the two pink arrows highlight what I'll be looking for - a MACD centerline test and a 50 day SMA test. The 50 day SMA currently resides at 2131, which is interesting given that the S&P 500 recently cleared major price resistance at 2131 (prior all-time high established in May 2015). A drop to that level would likely help the RSI move back into the 40s and offer up better reward to risk opportunities in the weeks ahead.
Sector/Industry Watch
Over the past week, the Dow Jones U.S. Waste & Disposal Services index ($DJUSPC) has been the worst performing industry group within the industrial sector. However, this group recently made a breakout on its long-term chart and is most likely seeing some short-term profit taking before another push higher. Here's that weekly chart:
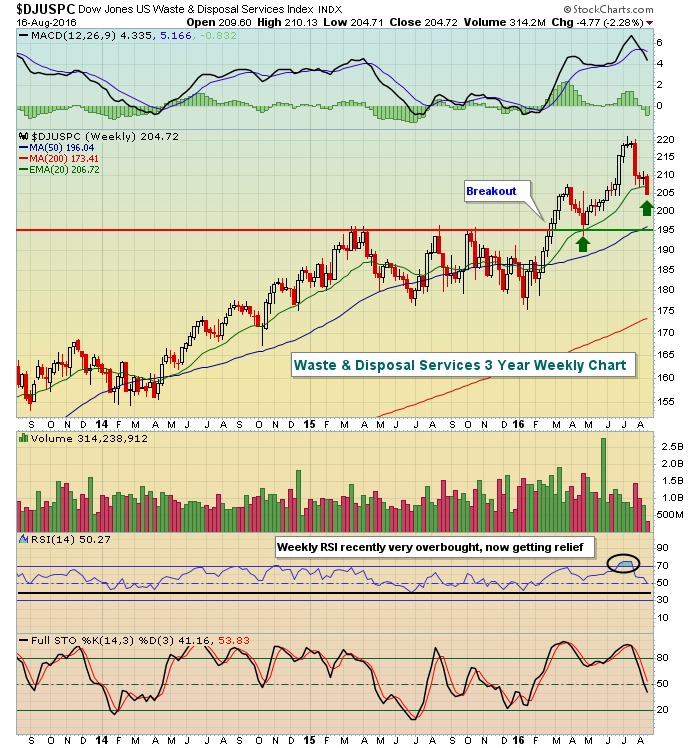 The two green arrows mark rising 20 week EMA support given the strength in the weekly MACD. Recently, the DJUSPC was extremely overbought and needed the short-term relief it's been seeing. A reversal by Friday's close back above the 20 week EMA would likely mark a short-term bottom. If the weakness continues, look to price support at 195 for a reversal. As the weekly RSI moves closer and closer to 40 support, the reward to risk here looks better and better.
Historical Tendencies
Since 1950 on the S&P 500, the 17th and 18th calendar days of all months have produced annualized returns of 15.10% and 16.55%, respectively, and that's much better than the 9% average annual return that the S&P 500 typically enjoys. Unfortunately, the 19th through the 25th calendar days have ALL produced annualized returns beneath that 9% benchmark. In fact, the 5.86% annualized return on the 21st is the ONLY day in this period with positive annualized returns.
Key Earnings Reports
(actual vs. earnings):
ADI: .82 vs .76
EV: .56 vs .56
LOW: 1.37 vs 1.42
PLCE: (.01) vs (.24)
SPLS: .12 vs .12
TGT: 1.23 vs 1.13
(reports after close, estimate provided):
A: .47
BGG: .52
CSCO: .55
NTAP: .18
NTES: 2.56
SNPS: .43
Key Economic Reports
None
Happy trading!
Tom


