Market Recap for Wednesday, August 17, 2016
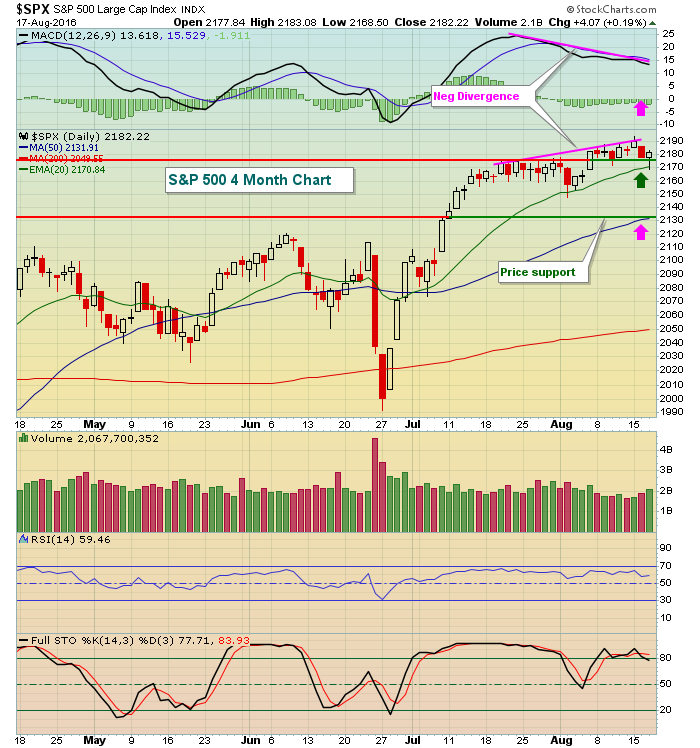
The Tuesday selling continued into early Wednesday, but initial support held in the support zone that was highlighted yesterday. 2170-2175 was the support zone and the S&P 500's intraday low was 2168 late Wednesday morning before the buyers returned in the afternoon session. Here's a reprint of the four month S&P 500 chart provided yesterday:
 You can now see that Wednesday's candle is a hammer off the rising 20 day EMA test. Note that the 2168 low on that candle represents very solid support. I'd expect that the next low beneath that level is not as likely to reverse.
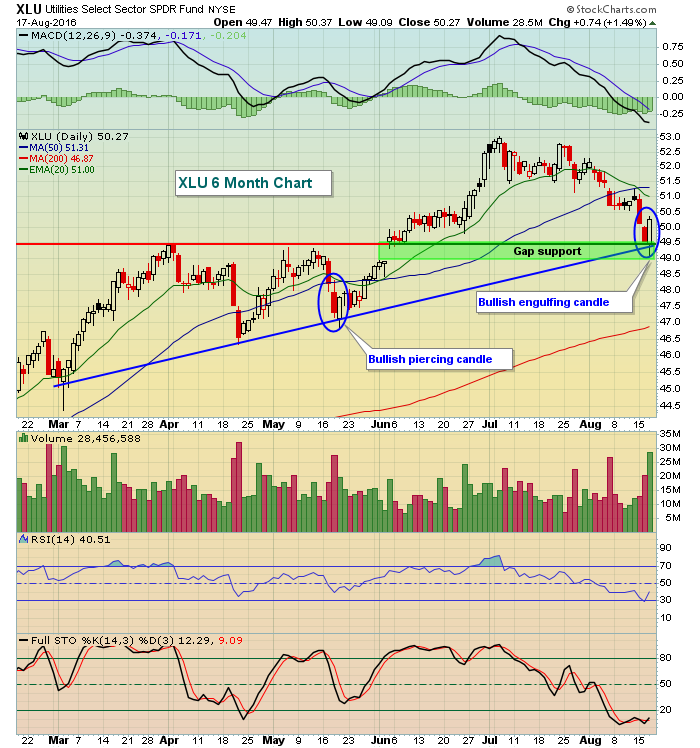
Six of the nine sectors reversed into positive territory like the benchmark S&P 500. Leading that group was utilities (XLU, +1.49%), which printed a very bullish engulfing candle at gap support. Take a look:
 Consumer discretionary (XLY, -0.23%) was the weakest sector as both home construction ($DJUSHB) and home improvement retailers ($DJUSHI) weighed. The latter struggled after Lowes (LOW) reported weak quarterly results and dropped by more than 5%.
Pre-Market Action
Wal-Mart (WMT) posted solid quarterly results this morning and is higher by nearly 3% in pre-market trading. Despite those solid results, U.S. stock futures are relatively flat with fractional gains in Europe this morning. Overnight, the Hang Seng ($HSI) rose nearly 1% while the Nikkei ($NIKK) fell roughly 1.5%.
Current Outlook
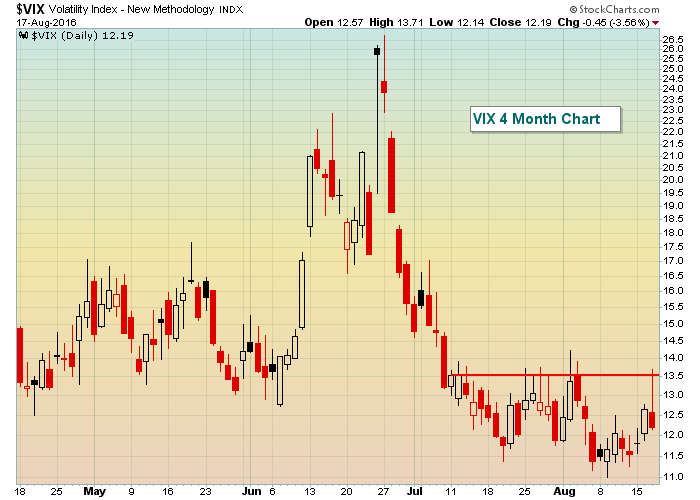
In addition to the stock market reversing at key support, the Volatility Index ($VIX) reversed at key resistance. Fear is a necessary element to extended selling and especially a key ingredient for a bear market. The bears were in charge intraday yesterday as the VIX was on the precipice of a major short-term breakout. It's important to watch sentiment indicators like the VIX as they help to evaluate market conditions for us. Check out the failure of the VIX to hold yesterday's breakout attempt:
 The red horizontal line marks resistance over the past five weeks. Should the VIX close above 13.50 to coincide with a short-term breakdown in the S&P 500 below 2168, I'd look for the selling to accelerate and the S&P 500 to potentially test the 50 day SMA and reset its daily MACD near the zero line.
Sector/Industry Watch
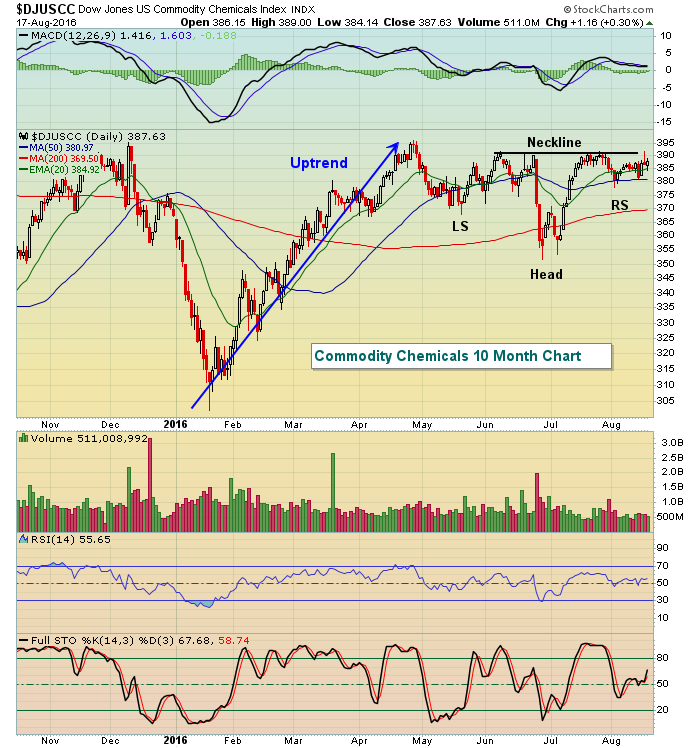
The materials sector (XLB) has been in a very tight range between 48-49 for the past several weeks. One industry group that could provide the short-term directional clue is commodity chemicals ($DJUSCC). It's been consolidating in a bullish pattern so I'd expect a breakout. Take a look:
 The group threatened a breakout on Tuesday before retreating. A breakout, however, would measure another 35-40 points higher, virtually assuring a breakout in the XLB as well.
Historical Tendencies
Since 1987, August has been the worst calendar month of the year for small cap stocks (Russell 2000). August has produced annualized returns of -8.04%. Currently, the Russell 2000 is higher by less than 1% in August 2016, but is entering its most bearish time of the month.
Key Earnings Reports
(actual vs. estimate):
WMT: 1.07 vs 1.02
(reports after close, estimate provided):
AMAT: .47
DV: .61
GPS: .59
ROST: .67
Key Economic Reports
Initial jobless claims released at 8:30am EST: 262,000 (actual) vs. 265,000 (estimate)
Philadelphia Fed survey released at 8:30am EST: +2.0 (actual) vs. +2.0 (estimate)
July leading indicators to be released at 10:00am EST: +0.2% (estimate)
Happy trading!
Tom


