Special Note
We're less than two weeks away from ChartCon 2016, the biggest online financial conference of the year!!! Be sure to reserve your spot today! CLICK HERE to learn more about the event, including the speakers and agenda. The theme this year is "building a successful technical trading system". Given the increased volatility of late, there is not a better time to learn what technical experts do to protect their portfolios during such uncertain times. Hope to "see" you there!
Market Recap for Friday, September 9, 2016
For me, price and volume do not lie in technical analysis. These two elements are our primary indications and we always need to pay attention to them. On Friday, volume accelerated and price action was extremely bearish, not just in terms of percentage losses, but also in terms of price support lost. Heavy volume combined with loss of price support must always be respected so we're now left in a much more precarious position as we enter the bearish second half of September.
Before we look elsewhere, let's look at the technical damage inflicted on the S&P 500 on Friday:
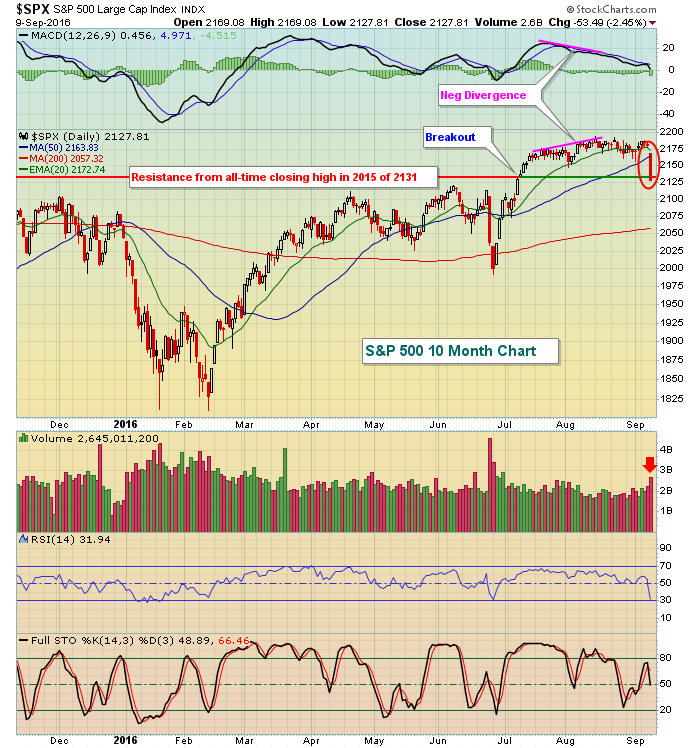 The current weakness surfaced after a negative divergence printed in the first half of August, reflecting slowing upward momentum. This warning was confirmed by the heavy volume selling and loss of rising 50 day SMA support. In the process, key 2131 price support was lost (red circle) in addition to the 50 day SMA. It's difficult to find anything bullish on this daily chart right now, meaning that the post-Brexit lows near 2000 could be the next stop. And when volatility ($VIX) increases like it did on Friday, losses can be very quick and painful. The VIX rose nearly 40% on Friday, indicative of the probability of very rapid losses.
The bulls have been a very resilient bunch, but unless we see a very quick powerful turnaround, the selling is likely to accelerate. Protect yourself accordingly.
Pre-Market Action
Well, it's about what I would have guessed Friday afternoon after U.S. stocks fell precipitously throughout the day, with major indices all finishing on their lows. FOLLOW THROUGH. U.S. futures are under pressure this morning with Dow Jones futures down another 40 points after tumbling nearly 400 points to end last week. Futures were much lower earlier this morning, but have recovered as we approach the opening bell.
The German DAX has followed the U.S. lead on Friday and that key European index has fallen over 200 points and, in the process, lost key price support in the 10450-10500 range. Check out the chart:
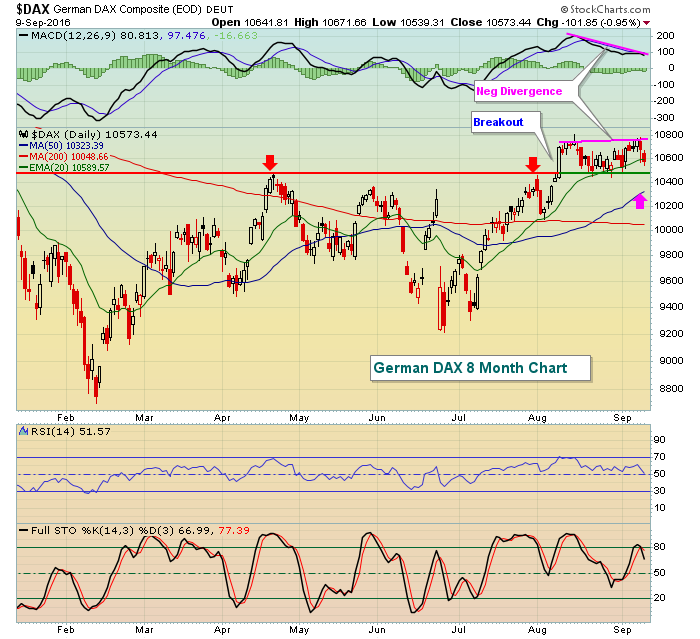 At the time the above chart was added to this article, the DAX was down more than 200 points this morning to trade at 10367. That's just less than 50 points away from a significant 50 day SMA test (pink arrow). Loss of price support, however, would follow the footsteps of the S&P 500 and would not be favorable for a continuing bull market.
Current Outlook
Until Friday, I remained "cautiously bullish", respecting the bullish price action, but concerned about the overall rotation the past several months to a couple years to defensive areas of the market. If the market is turning bearish, why should we swim upstream and be bullish? I don't grow more cautious or bearish until we see price and volume breakdowns. That came on Friday and looks to continue at today's open. The market will need to prove to me that this is merely a blip in the seven and a half year old bull market. Rotation suggests otherwise and now price action has turned bearish. As a reminder, here are a few of the relative ratios I follow vs. the benchmark S&P 500 performance:
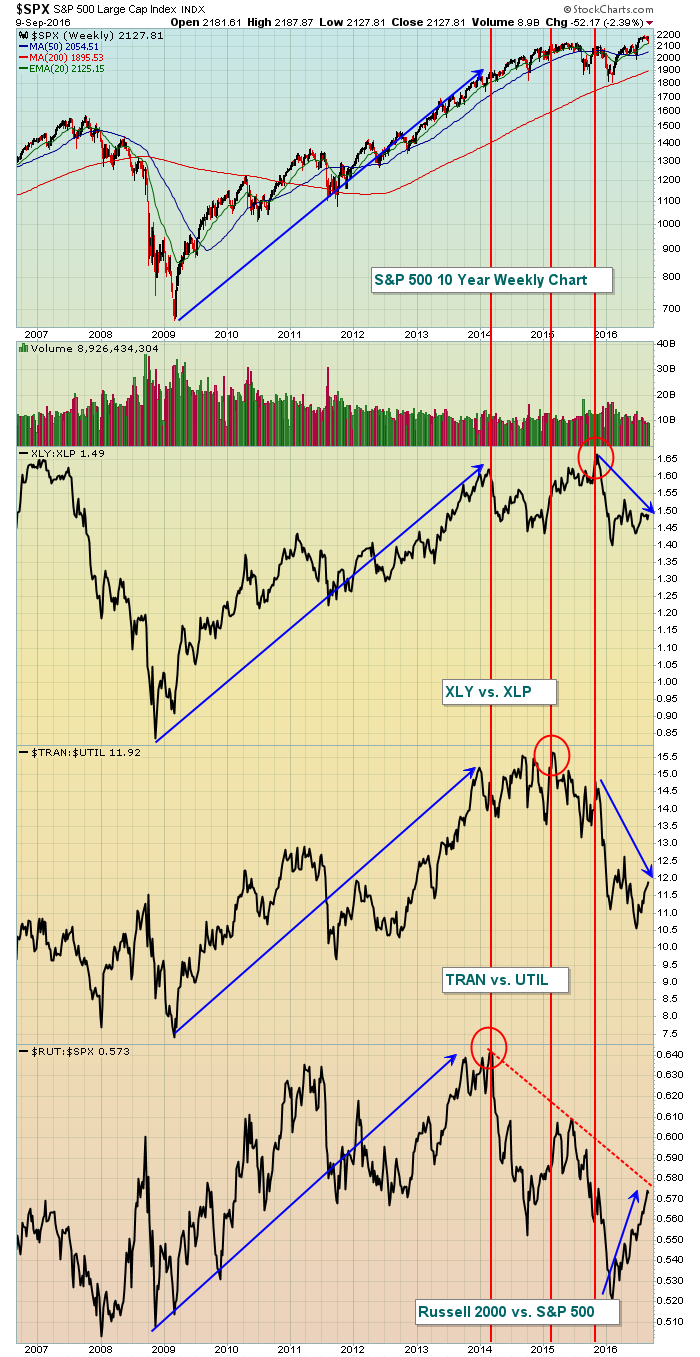 The media would have us believe that the market's fall on Friday was simply related to Fed comments about a potential upcoming rate hike. Whatever! A few days earlier, there was FedSpeak relating to rates and the market yawned. Why the sudden despair on Friday? Instead, the truth of the matter is that the market, whether you like it or not, has been turning more and more defensive over the past two years as the S&P 500 gains have grown smaller and smaller. The red vertical lines above highlight the timing that various relative ratios began to weaken. First up was the RUT:SPX that told us money was moving away from the more aggressive small caps on a relative basis. In an improving economic picture that should not happen.
Second, in the first quarter of 2015, transports topped relative to utilities (TRAN:UTIL). Again, that should not happen in a stengthening economic picture, the picture that the Fed has been trying to paint for several years. Finally and perhaps most importantly, the performance of consumer stocks turned as investors turned toward the defensive staples area relative to discretionary (XLY:XLP) in late 2015. Through it all, the S&P 500 continued pushing higher - and maybe it will continue to do so. But the risks have greatly increased as a result of the price and volume action on Friday. The price action is now confirming what the "below the surface" signals have been suggesting for quite awhile. Be aware of that as the risks of an upcoming bear market just grew rather significantly. Note I said "risks" as I'm not suggesting a guarantee. Nothing can ever provide us a guarantee, but the cards are currently stacked against the bulls and the second half of September is not likely to help.
The first major area of price resistance on the S&P 500 will be 2160, an area of price support that had held on multiple occasions recently. Broken support becomes resistance so let's see how the bulls fare if and when they approach this key level.
Sector/Industry Watch
Internet stocks ($DJUSNS), despite typical historical strength in September, appear to be poised for a sharp selling episode while remaining bullish longer-term. Their weekly RSI recently touched 70 and Friday's reversal left a nasty inverted hammer on its chart. This group enjoyed a significant rally after finally breaking above 1100 price resistance. That level now marks key price support and the rising 20 week EMA is at 1116. So a drop from its current price of 1166 down to a support range from 1100-1116 makes technical sense - especially in a potentially weak market the balance of September. Here's the current look at the chart:
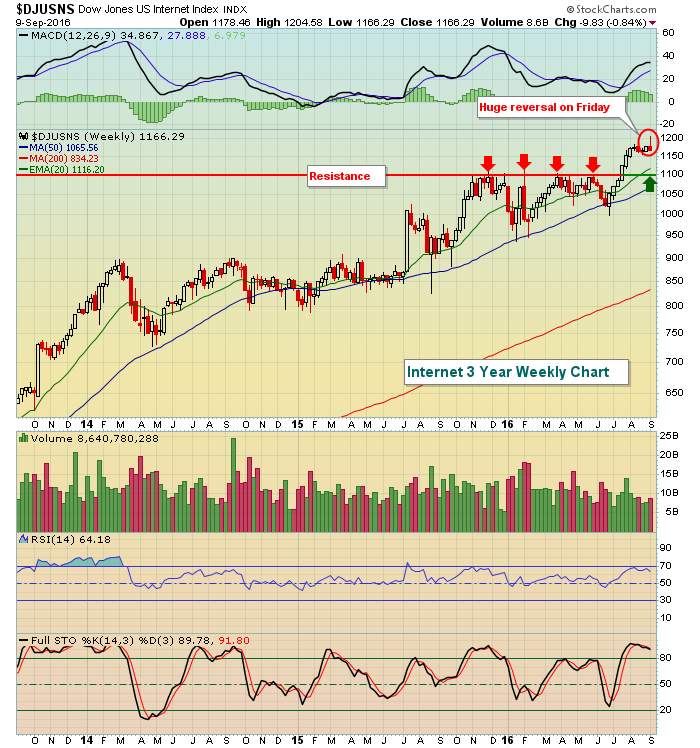 The red arrows highlight several breakout failures at 1100, marking key overhead price resistance. Once broken, that level becomes price support and the green arrow is marking that possible destination for this group over the next couple weeks.
Monday Setups
Considering the huge selloff on Friday and increased volatility, this is probably not the best time to be considering new trading positions so I will refrain from providing a setup here this week. I will discuss potential trades (and optimal entry points) during my Trading Places LIVE webinar, however, so if you'd like to attend to consider those, you can REGISTER HERE.
Historical Tendencies
Since 1971, September is the only calendar month on the NASDAQ to produce negative annualized returns (-6.05%). Here are the annualized NASDAQ returns for September during each decade:
1970s: -12.96%
1980s: -10.68%
1990s: +31.10%
2000s: -44.62%
2010s: +14.36%
Despite its reputation, September produced very bullish results in the 1990s when the overall market performed extremely well. But in the bear market laden 2000s, September was the clear weak link.
Key Earnings Reports
(reports after close, estimate provided):
UNFI: .62
Key Economic Reports
None, although several Fed officials will speak today
Happy trading!
Tom


