Market Recap for Wednesday, September 14, 2016
Market and sector performance was bifurcated on Wednesday with the NASDAQ performing much better on a relative basis, gaining 0.36% on the session. The Dow Jones, S&P 500 and Russell 2000 all finished with fractional losses. Leading the NASDAQ were technology stocks (XLK, +0.47%) which closed higher mostly by virtue of a very significant, high volume breakout by its leader, Apple (AAPL). After recently printing a bullish engulfing candle at its 50 day SMA and gap support, AAPL has surged with yesterday's strength carrying it past the highs of April and August. Check it out:
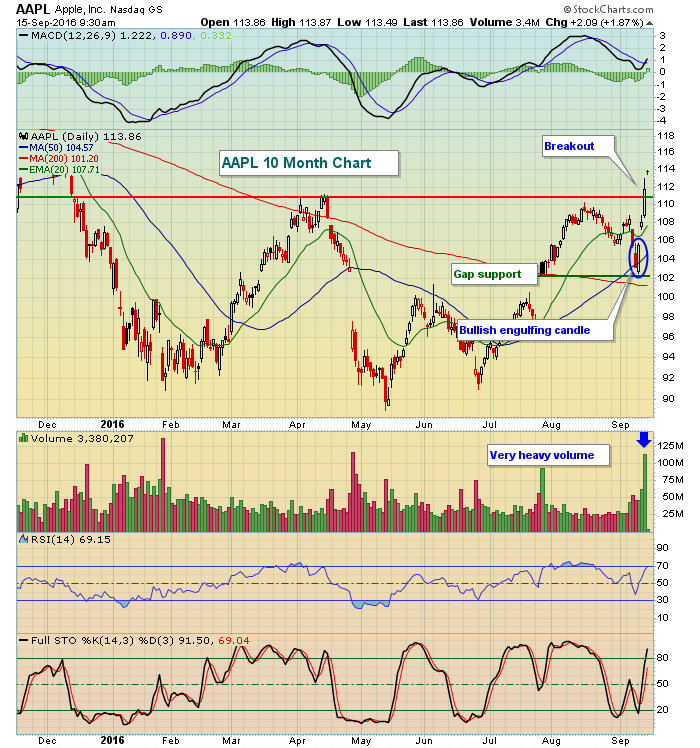 The volume surge above 100 million is important because it implies that this breakout is very likely to extend and that the price support (now at 111), along with the rising 20 day EMA, should provide very solid support on any short-term profit taking.
Weakness on Wednesday was felt primarily in energy (XLE, -1.18%) as crude prices ($WTIC) tumbled nearly 3%.
Pre-Market Action
After a very quiet week in terms of both earnings and economic reports, things are picking up today. A plethora of economic reports have hit the wires this morning with August retail sales a notable disappointment. Traders are following the "bad news is good news" strategy, however, with U.S. futures rising. Crude oil ($WTIC) is bouncing slightly, up 0.5% at last check and that's also aiding futures.
The Dow Jones futures are up 38 points, although they are well off their earlier highs. The German DAX continues to trade in a narrow range between 10250-10500 with a breakout or breakdown out of that range likely to trigger buying (breakout) or selling (breakdown) in the S&P 500.
Oracle Corp (ORCL) reports its latest quarterly results after the bell today and that is likely to impact the tech-laden NASDAQ on Friday, along with the fact that it's quad witching day.
Current Outlook
In the substituted words of singer Meghan Trainor, "It's All About The VIX". And unfortunately for the bulls right now, it's on the rise. Another surge in the afternoon on Friday left the VIX at 18.14, its highest close since the anxiety over Brexit. The bulls would like to see a quick reversal and the VIX back below 15, but for now must deal with a stressed market. Have a look at the recent spike:
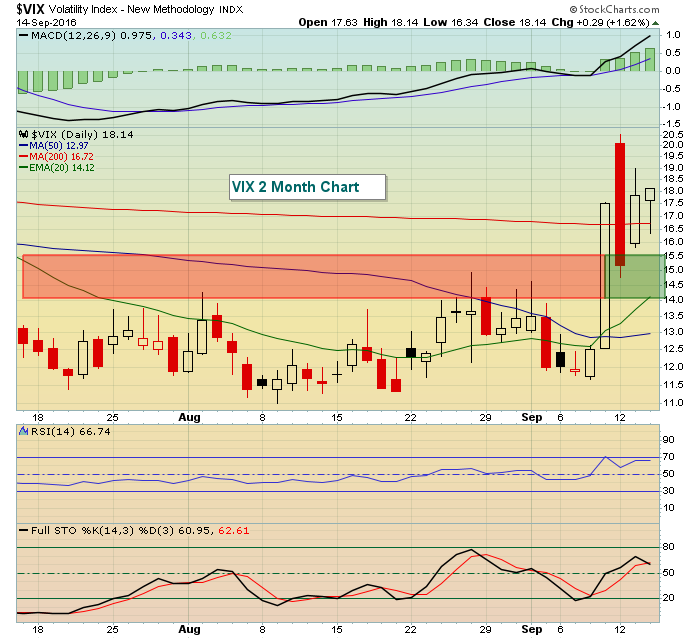 A rising VIX signals trouble because it represents expected volatility. The value of the VIX is determined in large part by the premiums on short-term S&P options. Premiums expand when price volatility is expected to accelerate. Typically, high volatility is associated with falling equity prices. Therefore, this uptrend in the VIX needs to be broken and support in the 14-15 range also needs to be broken to feel better about short-term market prospects.
Sector/Industry Watch
The Dow Jones U.S. Gambling Index ($DJUSCA) is one of the strongest industry groups and is ripping higher in the face of very bearish recent conditions. While the S&P 500 has seen its value dip beneath both its 20 day EMA and 50 day SMA for the first time since late June, the DJUSCA has surged higher on very heavy volume, suggesting this rally is far from over. Take a look:
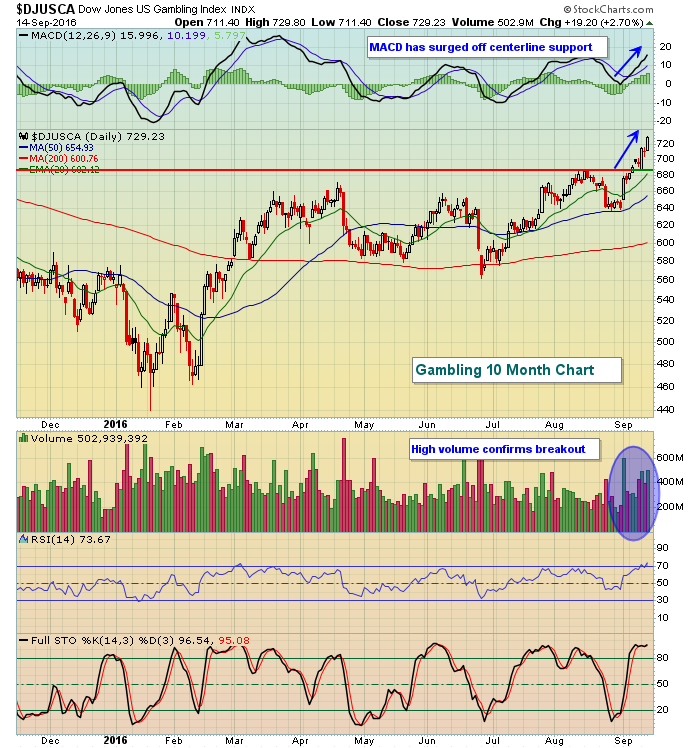 That's a 14% move higher in the past two weeks while the S&P 500 has dropped more than 3% over the same period. Groups that outperform on a relative basis are generally solid groups to enter during pullbacks, especially relative pullbacks on lighter volume.
Historical Tendencies
Next week we will enter a very bearish historical period on all of our major indices. The Russell 2000 has produced annualized returns by day as follows since 1987:
September 19 (Monday): -24.19%
September 20 (Tuesday): -74.75%
September 21 (Wednesday): -166.15%
September 22 (Thursday): -145.04%
September 23 (Friday): -50.35%
September 26 (following Monday): -2.74%
September 27 (following Tuesday): -21.97%
Key Earnings Reports
(reports after close, estimate provided):
ORCL: .54
Key Economic Reports
Initial jobless claims released at 8:30am EST: 260,000 (actual) vs. 265,000 (estimate)
August PPI released at 8:30am EST: +0.0% (actual) vs. +0.1% (estimate)
August Core PPI released at 8:30am EST: +0.1% (actual) vs. +0.1% (estimate)
August retail sales released at 8:30am EST: -0.3% (actual) vs. +0.0% (estimate)
August retail sales ex-autos released at 8:30am EST: -0.1% (actual) vs. +0.3% (estimate)
September Philadelphia Fed Survey released at 8:30am EST: 12.8 (actual) vs. 2.0 (estimate)
September Empire State manufacturing survey released at 8:30am EST: -1.99 (actual) vs. -1.00 (estimate)
August industrial production released at 9:15am EST: -0.4% (actual) vs. -0.2% (estimate)
August capacity utilization released at 9:15am EST: 75.5% (actual) vs. 75.7% (estimate)
Happy trading!
Tom


