Market Recap
First, I'd like to thank everyone who attended ChartCon 2016, making it a HUGE success! It was great interacting with folks from around the globe via Guidebook and I can't wait to have the opportunity to do it again! I will be back on schedule with my blog starting today and my webinars will be back up and running on Monday.
When I left last week, the S&P 500 was at 2163 and it fell a cumulative total of 4 points while I was gone. The good news is that the rotation that's taken place has been solid technically. Industrials (XLI), consumer discretionary (XLY) and technology (XLK) have led the stock market on a one week basis and that rotation, should it continue, would be bullish for equities in the fourth quarter.
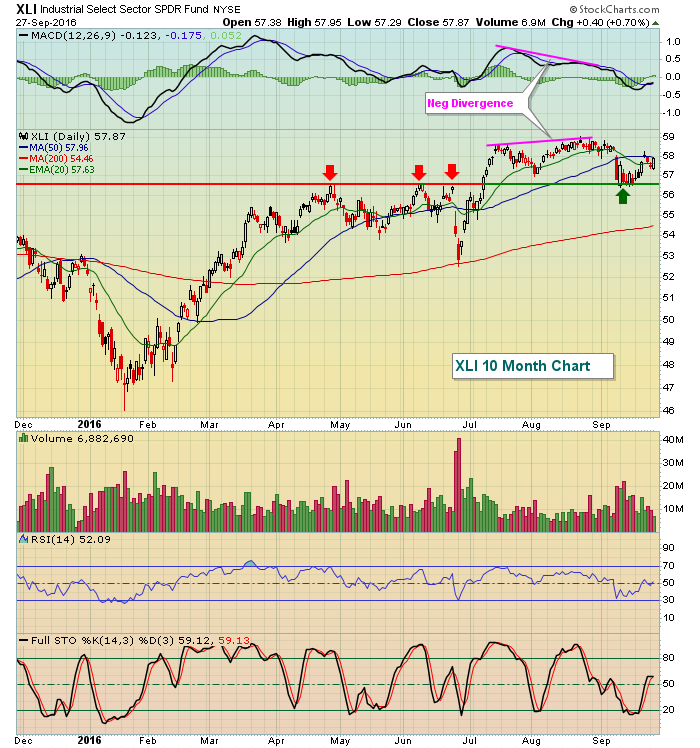
Technology (XLK, +1.10%) and consumer discretionary (XLY, +1.02%) both enjoyed big gains on Tuesday as semiconductors ($DJUSSC) and recreational services ($DJUSRQ) paced those gains in each sector, respectively. It was an across the board advance as every industry group in those two sectors advanced except for automobiles ($DJUSAU) and publishing ($DJUSPB). The chart on the industrials sector is interesting, check it out:
 In terms of price action, the XLI looked quite bullish at the end of August, breaking out to fresh highs. But the MACD suggested momentum was slowing and we've since seen a selloff in industrials back to test price support while the MACD made the trip back down to centerline support, actually a bit beneath it. For me, now the question becomes do we clear price resistance or support first?
The Fed's decision to wait on a further increase in interest rates has left the 10 year treasury yield ($TNX) reeling the past two weeks and that's been a big benefit to utility stocks. Some profit taking kicked in on Tuesday, however, with the XLU falling back toward key moving average support. The rising 20 day EMA will be important there.
Pre-Market Action
U.S. futures are flat as we prepare to open a new trading day. Fed officials are lined up to speak today, so traders will be watching every word they say and trying to decipher the next Fed move - and the timing of such a move.
Crude oil ($WTIC) is higher by 1% and gold ($GOLD) continues to meander between 1300-1375. The next rate hike, should one occur, would likely put upward pressure on the U.S. dollar ($USD) and that could be the catalyst to a breakdown in gold. It's at least worth considering as we watch the Fed action unfold.
Europe is mostly higher this morning, while the Tokyo Nikkei ($NIKK) tumbled 218 points, or 1.31%, overnight.
Current Outlook
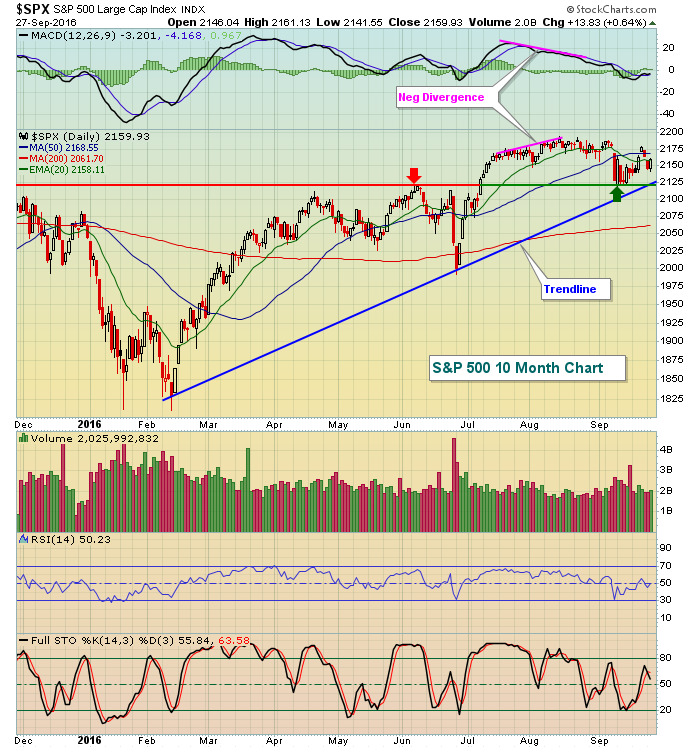
It's been a week, so let's take a look at the daily chart of the S&P 500 and see where we stand:
 We had previously discussed the negative divergence that emerged in August and that slowing momentum issue has since been resolved with the MACD now hovering close to its centerline. For me, it now comes down to price support vs. price resistance. We're consolidating and I wouldn't expect too much in either direction until we break out or break down. The key range for now is 2120-2190. There is one problem on the next breakout - and it could be a biggie. The weekly MACD is now pointing lower so another weekly close at an all-time high will most likely result in a negative divergence on the longer-term chart and those can be problematic for weeks or even months. Occasionally, they mark a major top to begin a bear market. But we'll worry about that when we get there. In the meantime, expect more consolidation with the aforementioned price levels marking key support and resistance.
Sector/Industry Watch
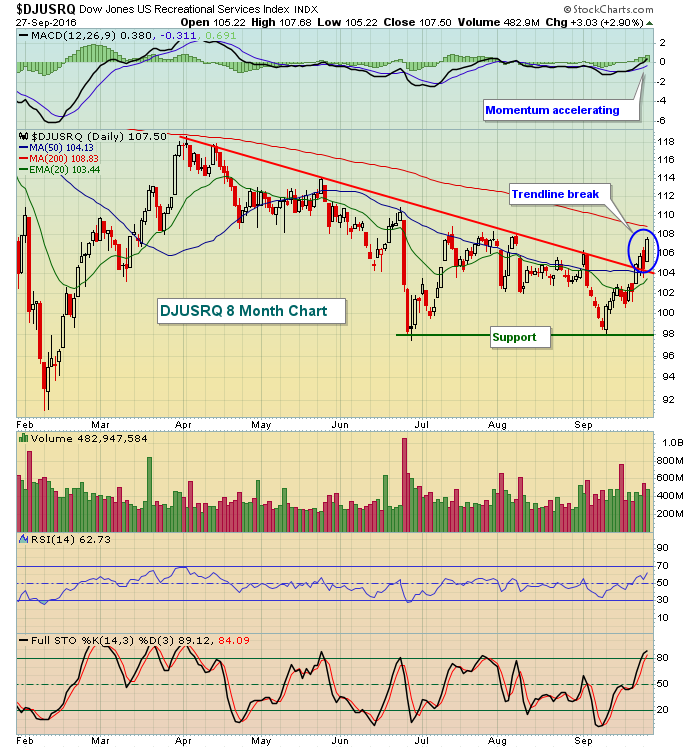
Recreational services ($DJUSRQ), as you can see below in the Historical Tendencies section, typically performs quite well from September through December. Technically, the bullishness has been ramping up as well after early September weakness. Take a look:
 This renewed strength, along with a bullish seasonality pattern, suggests the DJUSRQ is one industry group you don't want to overlook as we head into the S&P 500's seasonally bullish fourth quarter.
Historical Tendencies
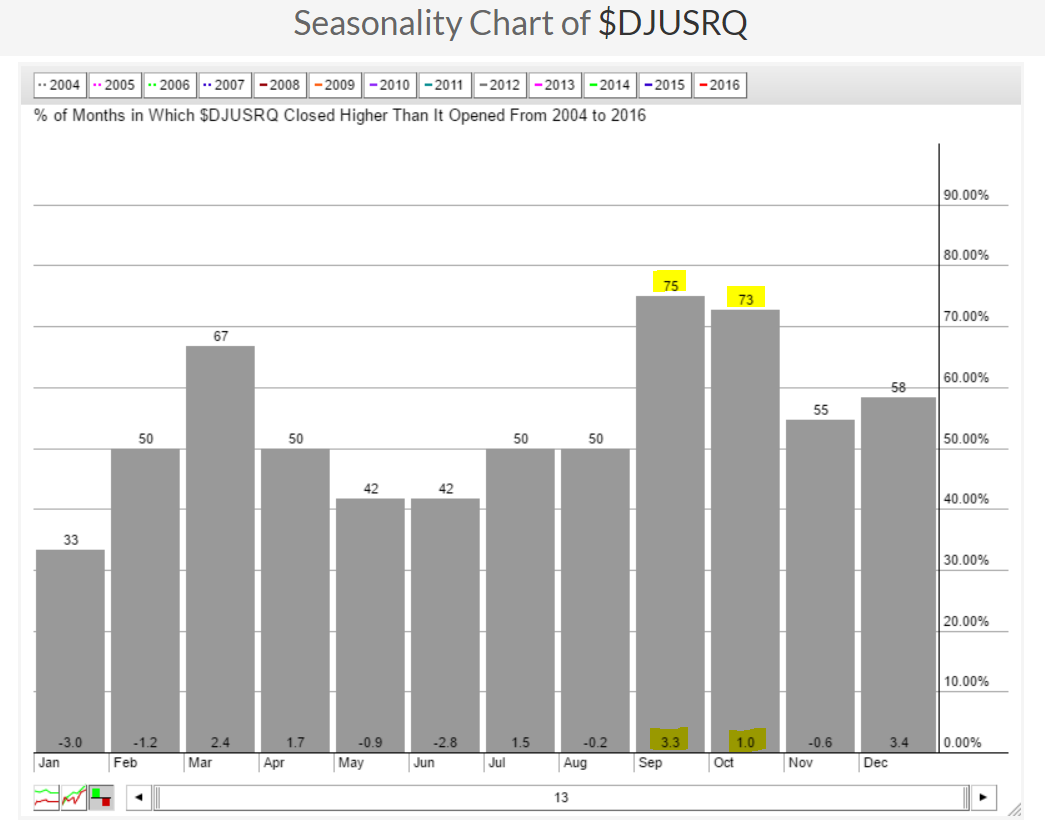
Few industry groups perform well during the month of September as our major indices tend to perform worst in this month. In the consumer discretionary space, the Dow Jones U.S. Recreational Services index ($DJUSRQ) is an exception. Check out the historical returns for the DJUSRQ over the past 20 years:
 The DJUSRQ is one of the best performing groups in September and that strength tends to carry over into October and after a brief seasonal slump in November, the fourth quarter strength resumes in December.
Key Earnings Reports
(actual vs. estimate):
BBRY: (.03) vs (.10)
PAYX: .60 vs .57
Key Economic Reports
August durable goods released at 8:30am EST: +0.0% (actual) vs. -1.9% (estimate)
August durable goods ex-transports released at 8:30am EST: -0.4% (actual) vs. -0.5% (estimate)
Happy trading!
Tom


