Market Recap for Wednesday, September 28, 2016
Energy shares (XLE, +4.32%) soared on Wednesday to their largest single day gain of the year as crude oil ($WTIC) gained more than 5% on the back of OPEC's agreement to curb oil production. This was the first such agreement since 2008 and kept oil bears on the defensive throughout yesterday's session. Crude oil remains in a bullish reverse head & shoulders pattern as we await either a breakout above $52 per barrel or a breakdown beneath $40 per barrel to confirm or negate the pattern. Certainly, a curb of production could be the catalyst to trigger much higher oil prices, but we'll have to wait to see if it's enough to change the balance between world supply and demand. The charts will tell us that. Here's a reminder of the long-term pattern on crude oil:
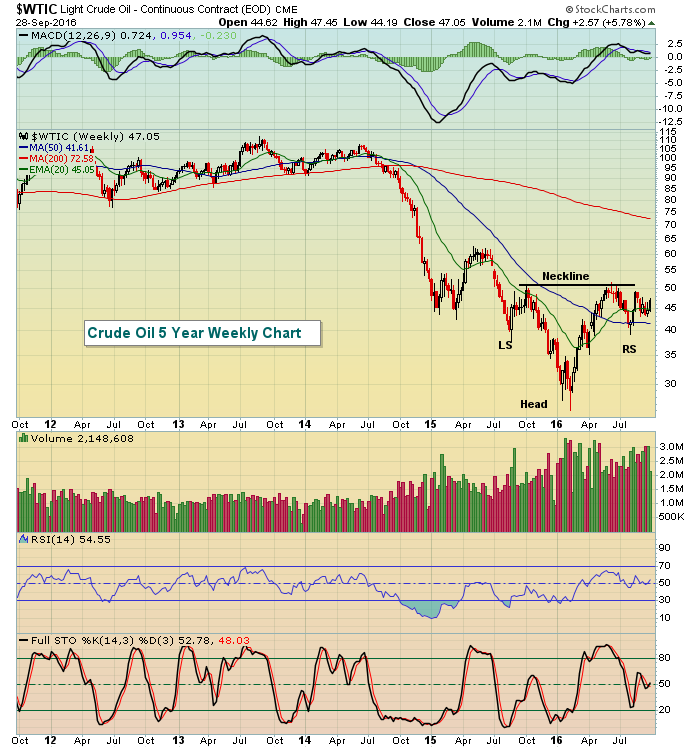 Despite the huge gains on Wednesday, you can see that the action still fell within that $40-$52 per barrel trading range. Still, energy remains one of the strongest groups in 2016 and should be included in most investing and trading portfolios so long as its relative performance remains strong.
While yesterday's action was quite bullish, we haven't seen a breakout yet on our major indices. That's the bad news. The good news, however, is that the primary laggards were defensive sectors on Wednesday. If that relative behavior continues to accompany a breakout, we'd most likely be resuming the 7 1/2 year bull market.
Pre-Market Action
It was a green night overnight as Asian markets finished higher. Europe has continued that strength with major indices there on the rise this morning as well. U.S. futures are slightly lower, however, as we see some profit taking in the oil patch after the huge Wednesday advance.
Final Q2 GDP was reported this morning slightly better than expected while jobless claims fell and were reported below expectations.
Current Outlook
If you're looking for a possible sign of a top, consider the weekly chart of the S&P 500:
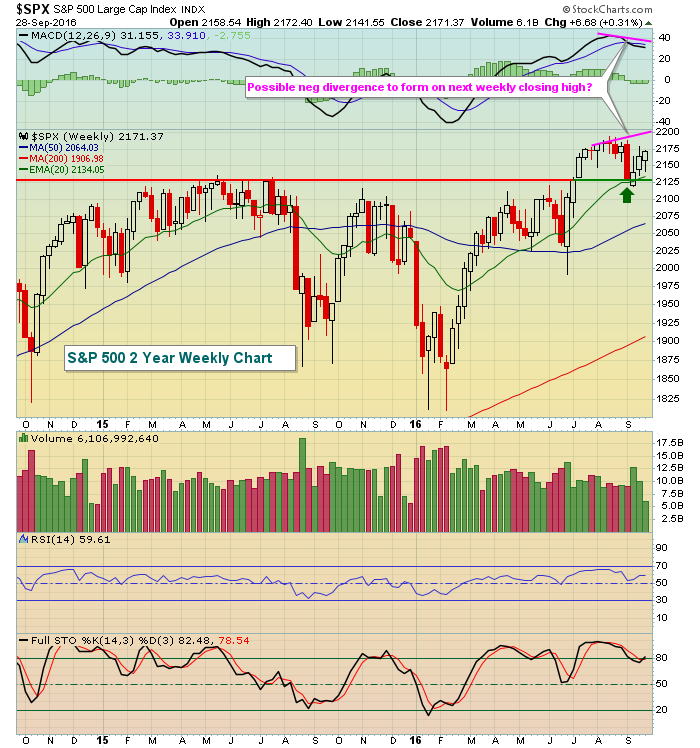 The bounce recently occurred off of 20 week EMA support, exactly where I'd expect to see the bulls come together. However, the next rally could pose a big momentum problem. That, coupled with a subsequent price breakdown beneath 2120 (price support), would be a major warning sign and given the performance of key relative ratios like the XLY:XLP and $TRAN:$UTIL, we could witness the market top for quite awhile. But there are two sides to every story and this technical story could end with weekly prices rising, the breakdown never occurring and the weekly MACD moving to fresh highs to eventually eliminate the negative divergence.
This is something to at least ponder as the bulls attempt to regain control of the action with another all-time high.
Sector/Industry Watch
Energy remains very strong on a relative basis. There was a brief relative dip in the second half of July, but otherwise energy has performed exceptionally well vs. the S&P 500 and I expect that to continue. Below is the relative chart vs. the SPX and highlights the key relative levels to watch as we move forward:
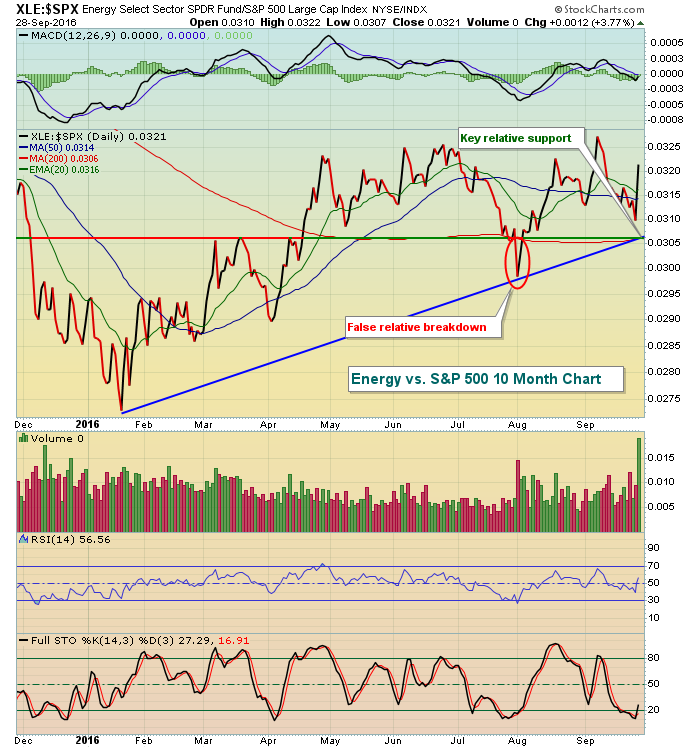 Both relative trendline support and key relative price support intersect at the .0305 area so keep that in mind. A relative break beneath .0305 would at least cause me to re-evaluate my stance. Until then, however, consider keeping energy in your portfolio - either with the ETF (XLE) or with individual stocks in strong energy industry groups. That would certainly include pipelines ($DJUSPL), which have been featured in this blog on multiple occasions over the past few months.
Historical Tendencies
I've discussed previously that the July 17th to September 27th stretch is the worst of the year and the true "go away" period. This year, we began the period on the S&P 500 at 2161.74 and we ended it at 2159.93. Since 1950, this two month ten day period has averaged losing 0.43% so we were once again following history. It could have been worse, but the consolidation is understandable given history.
Key Earnings Reports
(actual vs. estimate):
ACN: 1.31 vs 1.30
CAG: .61 vs .48
PEP: 1.40 vs 1.32
(reports after close, estimate provided):
COST: 1.73
Key Economic Reports
Initial jobless claims released at 8:30am EST: 254,000 (actual) vs. 260,000 (estimate)
Final Q2 GDP released at 8:30am EST: +1.4% (actual) vs. +1.3% (estimate)
August pending home sales index to be released at 10:00am EST: +0.5% (estimate)
Happy trading!
Tom


