Market Recap for Monday, October 10, 2016
Crude oil ($WTIC) rose more than 3% on Monday and energy (XLE, +1.57%) was easily the best performing sector as a result. Utilities (XLU, +0.83%) saw surprising strength as did REITs. The strength for the XLU and REITs, however, is not likely to hold up today given the breakout in the TNX above 1.74%.
All other sectors finished higher on Monday with one exception: consumer staples (XLP, +0.00%). While there was no overall strength in the XLP, there was rotation within the sector. Brewers ($DJUSDB) and Distillers ($DJUSVN) gained 2.02% and 1.28%, respectively, while nondurable household products ($DJUSHN) and tires ($DJUSTR) lost 0.94% and 0.70%, respectively. Tires had been performing extremely well the past three months, rising more than 23% over that time frame, but yesterday may have topped at key price resistance with a negative divergence in play. Check out the DJUSTR:
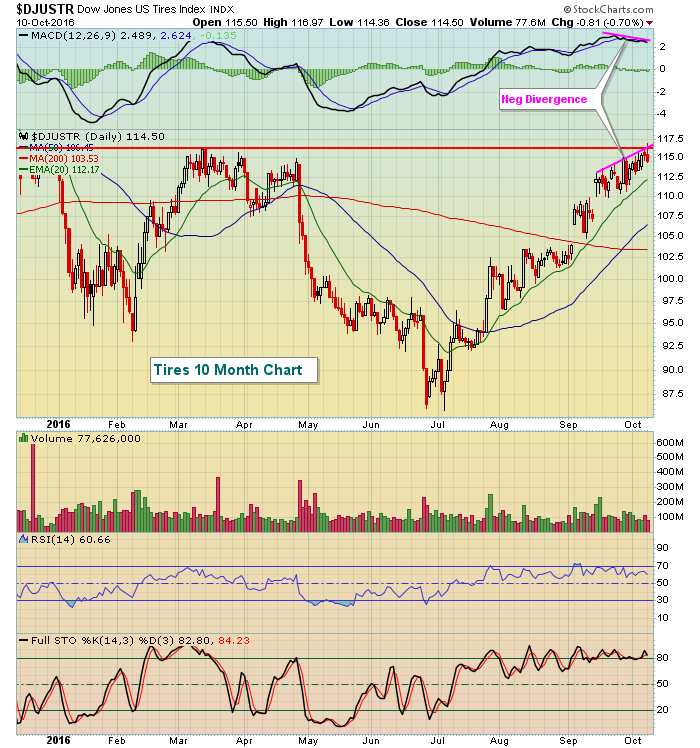 While a breakout should be respected, the reversal after an intraday breakout, coupled with the appearance of slowing price momentum, would have me selling this group in the very near-term with perhaps re-entry after a MACD centerline reset or a 50 day SMA test. Note that as prices were rising over the past three months, the rising 20 day EMA held as support throughout the rally. But the negative divergence suggests the risks of holding - or buying - are much greater now.
Pre-Market Action
The biggest news this morning, as far as I'm concerned, is the spike in the 10 year treasury yield ($TNX) to 1.78%. This clears a path to 2.00% technically and the result will likely be financial shares leading a charge higher in equity prices. Banks ($DJUSBK) and life insurance ($DJUSIL) both tend to see profits rise in a rising interest rate environment and today's bond market action is beginning to signal that another Fed rate hike could be well on its way.
Dow Jones futures are down slightly this morning - 39 points - and moving opposite the major indices in Europe, which are all fractionally higher.
Alcoa (AA) reported its quarterly earnings results this morning, missing EPS forecasts by three pennies. AA reported .32 vs. Wall Street consensus estimates of .35.
Current Outlook
The leadership enjoyed by the energy sector in 2016 could become even stronger if crude oil prices break out from their current reverse head & shoulders pattern. This is a bottoming formation that, if confirmed, carries a measurement to potentially $75-$80 per barrel. From the chart below, you can see that the positive correlation between the XLE and $WTIC is very strong so a breakout in crude oil would be extremely bullish for the energy space. Check it out:
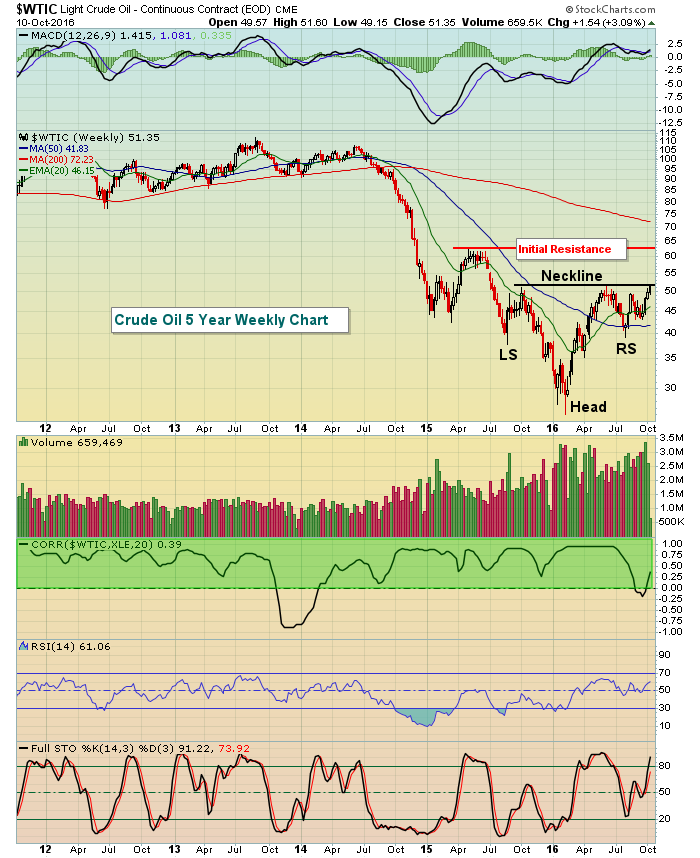 The measurement on this reverse head & shoulders pattern is calculated by determining the difference between the neckline ($52 per barrel) and the low ($27 per barrel), which is $25 per barrel and then adding that to the breakout point. That would suggest crude oil rising to $77 per barrel. If that were to occur, I think it's pretty clear from the positive correlation (green shaded area) between crude oil and energy shares that the XLE would likely push much higher as well.
Sector/Industry Watch
Technology has been strong and we're in a sweet spot right now for internet stocks ($DJUSNS) - both historically and technically. We know that the last four calendar months of the year typically result in gains for this group and they're currently consolidating in a bullish ascending triangle pattern. Take a look:
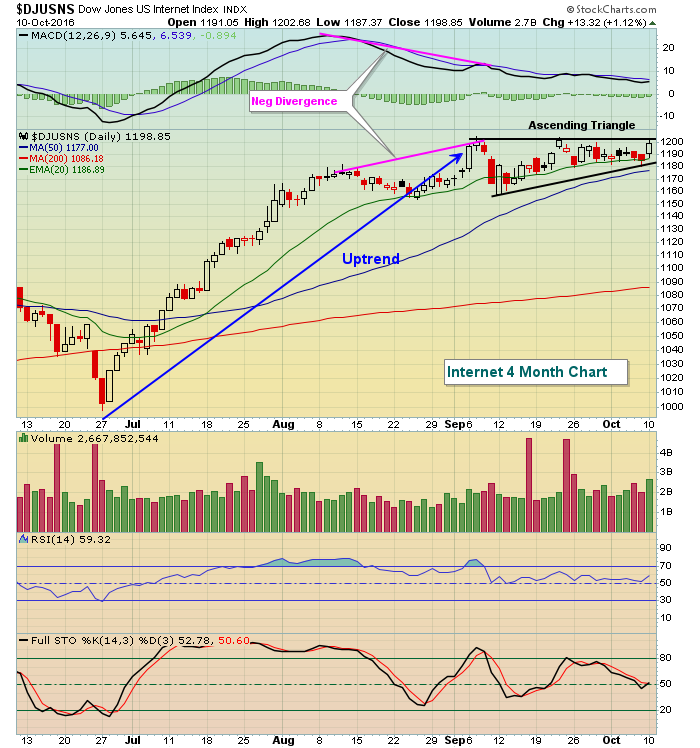 The current consolidation makes sense given that negative divergence that rose on the early September price high. Recent price lows have been close to the 1180 level and the rising 50 day SMA is now at 1177. That's where I'd expect to see buyers emerge on any short-term selling. A breakout would measure to roughly 1245-1250.
Historical Tendencies
I had documented how bearish the Russell 2000 usually starts the month of October, but there's no disputing the bullishness that we normally see from small caps during the middle of October. From October 10th through October 21st, the Russell 2000 has produced annualized returns of 49.95% since 1987.
Key Earnings Reports
(actual vs. estimate):
AA: .32 vs .35
FAST: .44 vs .45
OZRK: .66 vs .59
Key Economic Reports
None
Happy trading!
Tom


