Market Recap for Friday, October 7, 2016
It was another down day on Friday for Wall Street, but there were no technical breakdowns to suggest we'd see follow through this week. Instead, we saw the materials sector (XLB, -1.86%) endure a painful session after two decent days of gains. That's been typical of recent behavior - movement in one direction followed by a counter movement in the opposite direction. Only the financials (XLF) ended last week with a gain, rising 1.66% over the past five trading days. That has been one common theme of late - financials rising as the 10 year treasury yield ($TNX) rises. Here's a look at the TNX and its impact on key areas within financials:
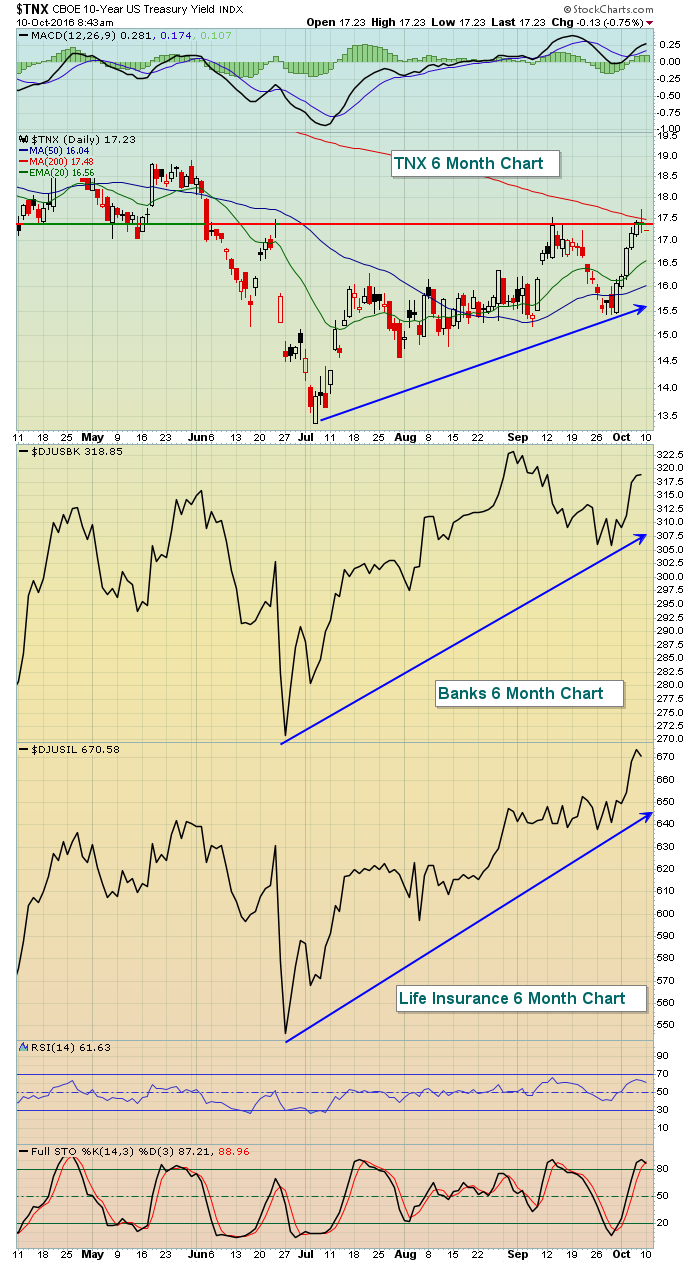 When treasury yields rise, it's an indication that money is coming out of treasuries. There's always a direct inverse correlation between treasury prices and treasury yields. If money comes out of treasuries, there's cash available to push equity prices higher. And rising rates are beneficial to banks and life insurance companies.
Pre-Market Action
There's not much going on in pre-market today as U.S. banks are closed to honor Columbus Day. The U.S. stock market, however, is open but there are no earnings or economic reports of consequence. One Fed official will be speaking in Australia at 10am EST and FedSpeak is always in the news these days.
Prices are higher in Europe this morning and that strength seems to be carrying over to the U.S. with Dow Jones futures up 100 points at last check. Also, crude oil prices are again on the rise with gains of 1.49%. Crude oil is nearing a very critical resistance level in the $51-$52 per barrel range. A breakout would be huge for the energy sector.
Current Outlook
While I discussed earlier that financials are in the spotlight in the very near-term, we cannot overlook the fact that technology (XLK) and energy (XLE) have been the best performing sectors over the intermediate-term. Those stories are likely to continue in the foreseeable future. Here's a chart that shows the relative performance of both the XLK and XLE vs. the S&P 500:
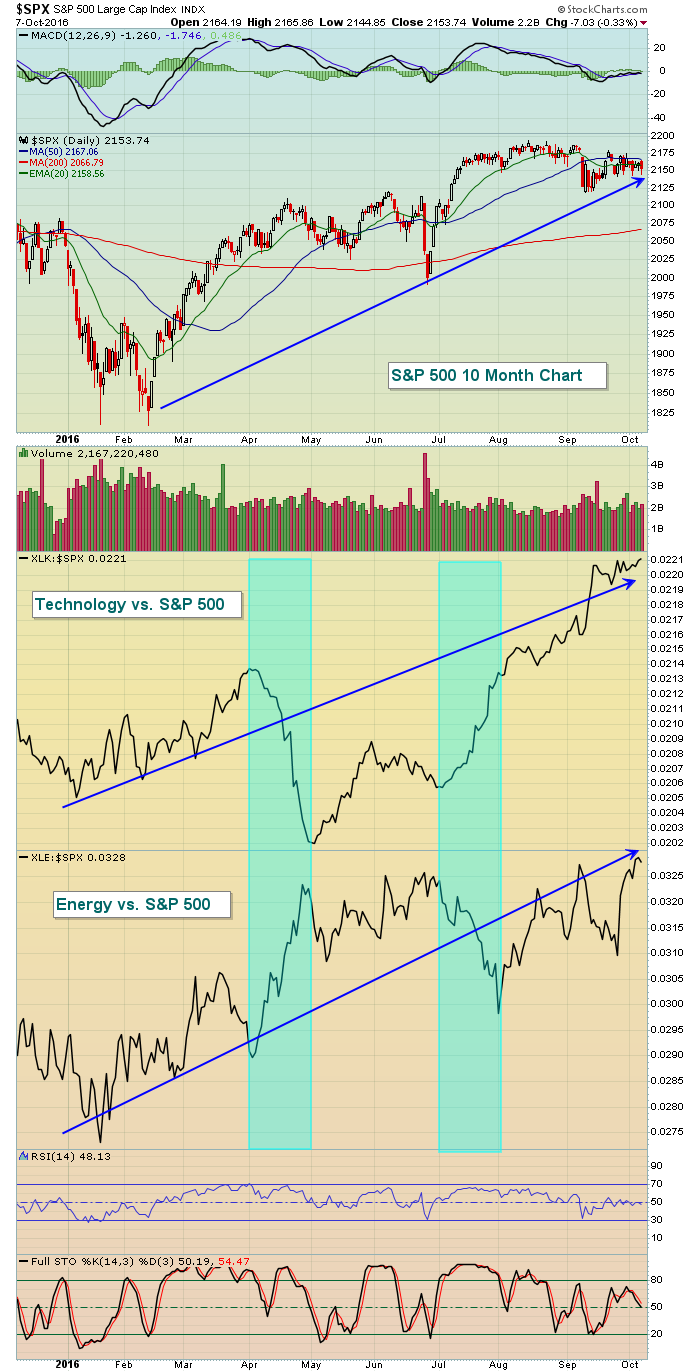 Couple points here. First, note that the charts of both the XLK and XLE are relative charts, showing how each sector has widely outperformed the S&P 500 in 2016. These are two sectors where you want to continue to consider investing/trading as they remain relative leaders. Second, check out those shaded areas in April and July. While both of these sectors have been relative outperformers for the year, these two shaded areas highlight the rotation that's been taking place. During April, technology clearly underperformed the S&P 500 by a very wide margin while energy shares led that benchmark index. But in July, post-Brexit, the roles reversed with technology providing a huge relative boost. One reason the bears cannot gain control of the action is that money continues to rotate between strong sectors, not allowing those key leaders to break down for very long. That's the hallmark of a bull market.
Sector/Industry Watch
Gold mining ($DJUSPM) fell more than 13% last week as the dollar (UUP) began to show short-term strength. It's important to realize that the dollar remains in a very bullish longer-term pattern and that always suggests we remain quite cautious with respect to commodities, especially gold. Check out how last week's weakness turned the technical tables on gold bulls:
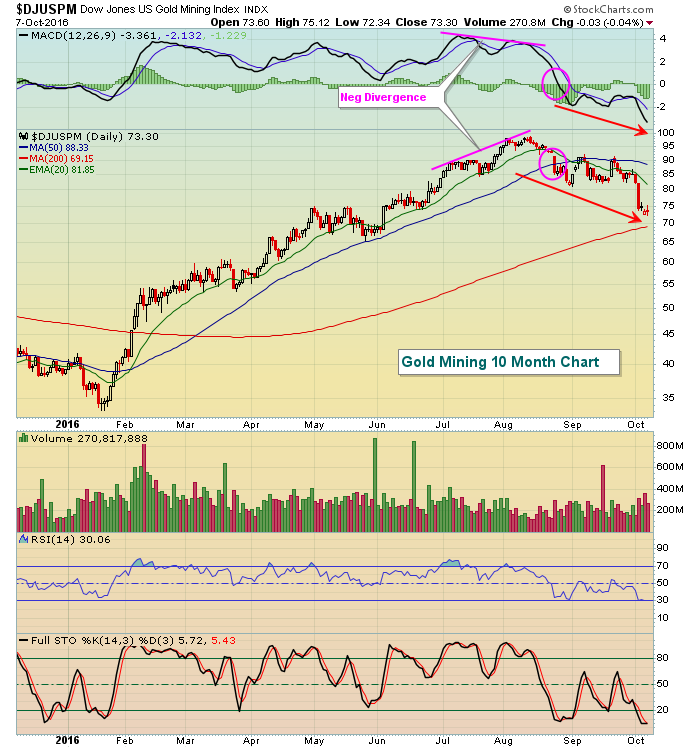 There was a negative divergence in early August, suggesting that short-term momentum had slowed. Normally, during an uptrend, a negative divergence typically results in sideways consolidation down to test a rising 50 day SMA and to reset the MACD at centerline support. But check out the pink circles above. They show that both of those key levels were violated and now bearish momentum is accelerating. While I suspect we'll see an oversold bounce soon, be careful if there's failure at the declining 20 day EMA. That would be indicative of more weakness ahead.
Monday Setups
I discuss all of my Monday setups during my Trading Places LIVE webinar that begins later today at 1pm EST. You can register for this webinar by CLICKING HERE.
As always, I'll give you a feel for the types of setups I like by providing you an example. On Thursday, Brinker Intl (EAT) pulled back to test the upper end of gap support and printed a hammer to potentially mark a short-term bottom. Check out the chart:
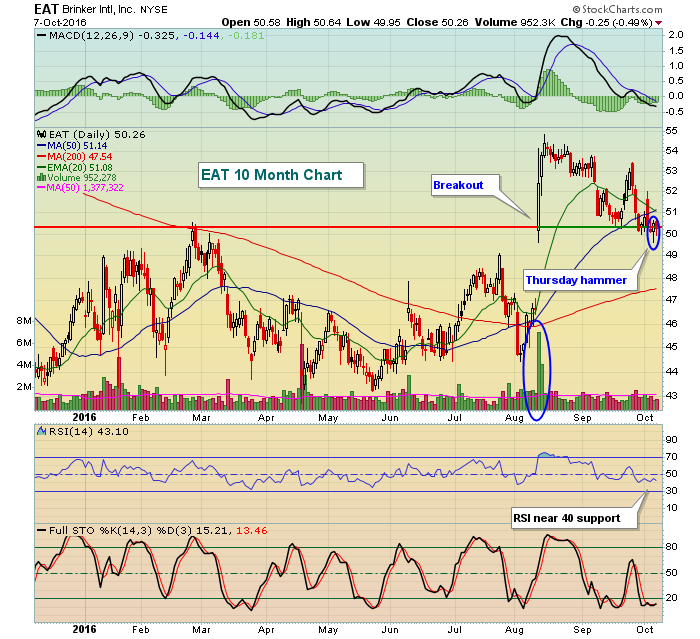 Shortly after its push higher on very strong volume, it reached a high of nearly 55 per share. Patience has allowed the stock to fall back to key support near 50 where, in my opinion, it becomes a much better reward to risk trade on the long side. It certainly doesn't guarantee a profitable trade and loss of intraday support at 49.60 could result in a gap fill to the bottom of gap support, which is at 46.67. Please determine your own risk tolerance before trading.
(Disclosure: I own EAT)
Historical Tendencies
We're approaching a fairly bullish period within October on the NASDAQ (results shown are since 1971) as this index has produced annualized returns as follows for each of the upcoming calendar days:
October 10 (today): +43.55%
October 11 (tomorrow): +114.42%
October 12 (Wednesday): +16.97%
October 13 (Thursday): +137.33%
October 14 (Friday): +41.29%
History has the back of the NASDAQ bulls this week, but we'll see how the action plays out.
Key Earnings Reports
None
Key Economic Reports
None
Happy trading!
Tom


