Market Recap for Monday, October 3, 2016
Q3 performance was fairly solid, especially on the NASDAQ where the strength in technology shares carried the load. Q4 didn't start off quite so well as each of our major indices finished down and eight of nine sectors were lower. The news wasn't all bad, though, as much of the weakness was concentrated in defensive areas like utilities (XLU, -1.41%) and consumer staples (XLP, -0.64%). Furthermore, a breakdown of the financial space indicates that the more defensive REITs dominated the bottom of that sector leaderboard. Check it out:
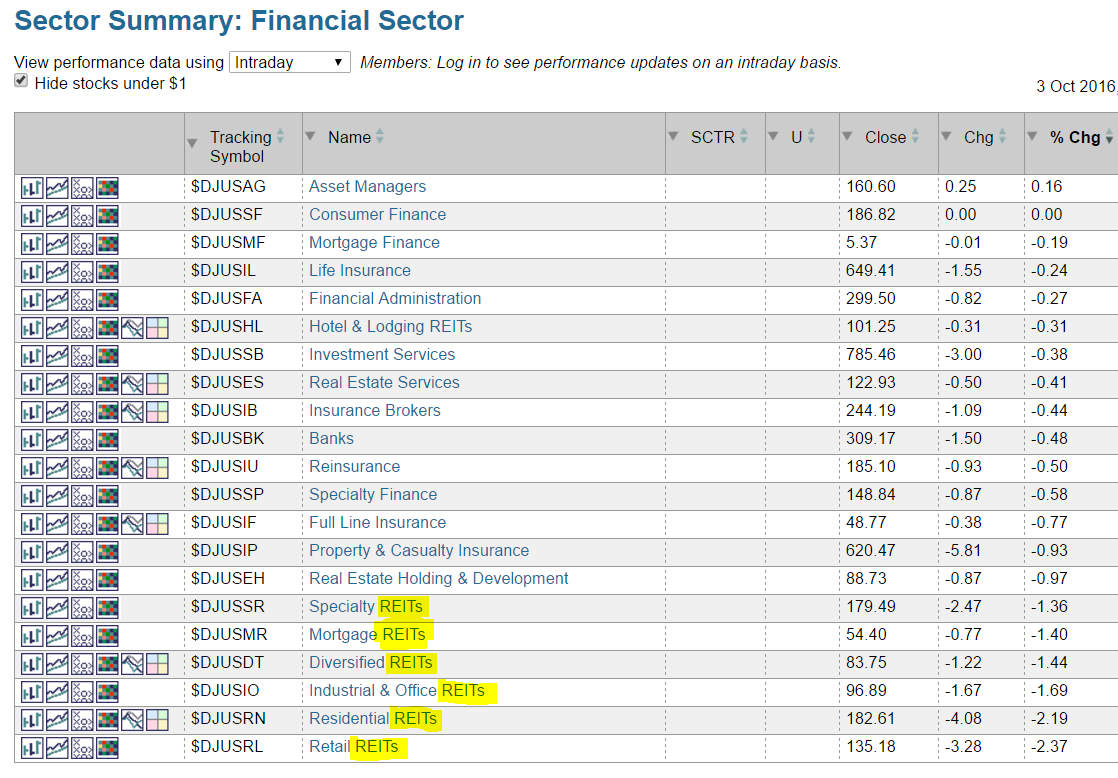 Six financial industry groups lost more than 1% on Monday and all of them were REITs. Dividend-paying defensive stocks have worked pretty well in 2016, but the selling to open the 4th quarter wasn't kind to these stocks.
The Dow Jones REIT index ($DJR) has been under pressure for the past two months, but the major price support level has yet to be tested. Check this out:
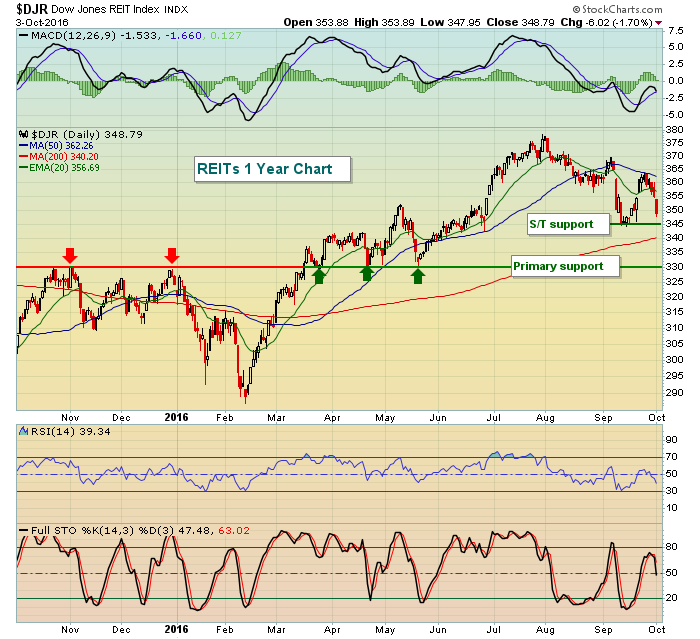 The three green arrows mark what I consider to be a major price support as the DJR in late June pushed to fresh highs. In an uptrend of higher highs and higher lows, we don't want to see that prior low lost as support. So, in the near-term 345 should be viewed as support. But if that level is lost, the much more significant price support at 330 comes into play.
Pre-Market Action
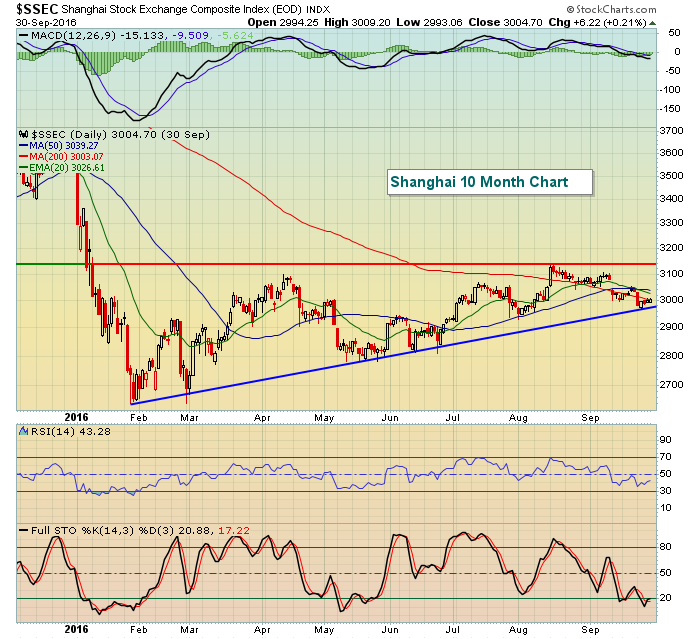
U.S. futures are clinging to small gains with a half hour left to today's market open. Futures are perhaps buoyed by gains across the globe last night and this morning. China's Shanghai Composite ($SSEC) gained just 7 points, but managed to climb back above the psychological 3000 level, which was lost in recent sessions. Also, a turn here on the SSEC would be bullish as it's testing key trendline support. Here's the visual:
 The Hang Seng ($HSI) and Nikkei ($NIKK) both had solid gains overnight. In Europe this morning, the Financial Times ($FTSE) is attempting to break to all-time highs just above the 7000 level. This is challenging highs from the turn of the century as well as highs reached in early 2015.
Current Outlook
In evaluating the strength and sustainability of any S&P 500 advance, I pay particularly close attention to a couple of key ratios - the XLY vs. the XLP (consumer discretionary vs. consumer staples) and $TRAN vs. $UTIL (transportation stocks vs. utility stocks). The reason is simple. If the economy is truly improving and higher earnings will lead the market higher, the XLY and $TRAN should be among the leaders and the ratios above should be rising strongly, preferably breaking out to new relative highs. While the recent strength in both these ratios is quite evident, it's that last part - breaking out to new relative highs - that's been lacking. I'll use the $TRAN:$UTIL ratio as my example today:
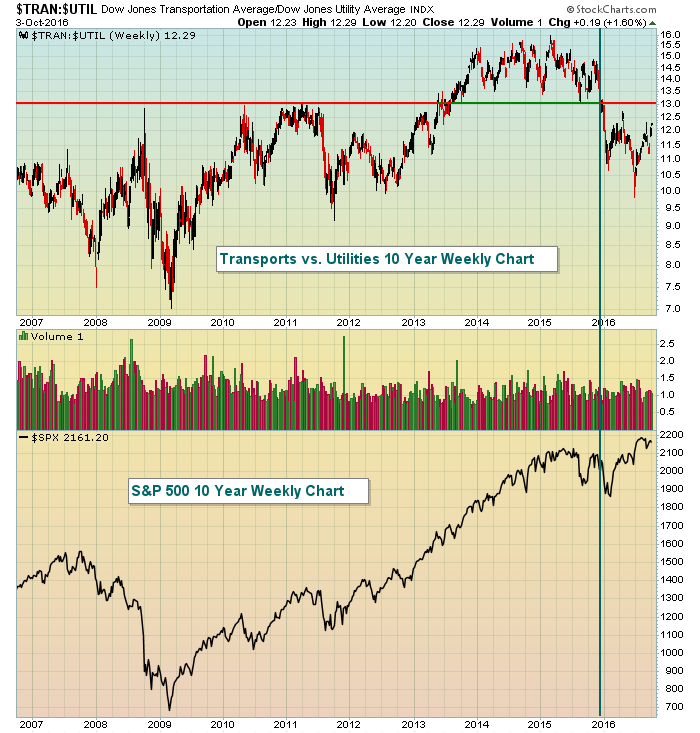 Let me emphasize a couple key points first. This relative ratio bottomed in 2009 at the same time the S&P 500 did. It followed the S&P 500 higher for seven years as money continued to rotate towards the more aggressive transport group. That is very bullish relative action and helped to sustain the bull market. The relative strength of transports has deteriorated significantly in 2016, causing reason for concern. However, these relative ratios are secondary to the combination of price/volume. If I'm unhappy with relative performance, it makes me cautious, not bearish. There's a difference. I generally turn bearish only when prices break down. The fact that money is rotating to the more defensive utility sector in 2016 is a reason for concern, not a reason to short. Big difference.
Having said that, the relative action in 2016 hasn't been great and the $TRAN:$UTIL ratio has a key 13 level that needs to be negotiated. If the S&P 500 can make another breakout to an all-time high with this ratio breaking 13, the action becomes much more bullish and sustainable in my view. I'd obviously prefer to see this ratio back at 16, but the first step is to clear key relative resistance levels and keep the short-term uptrend intact.
Sector/Industry Watch
The Dow Jones U.S. Delivery Services Index ($DJUSAF) recently broke out to fresh 2016 highs and appear poised for further price appreciation given its strengthening momentum. After a surge higher in March, the DJUSAF has mostly sideways consolidated until FedEx (FDX) provided a boost with its latest quarterly results close to two weeks ago. I'm expecting the rising 20 day EMA to provide support on any further short-term profit taking. Have a look:
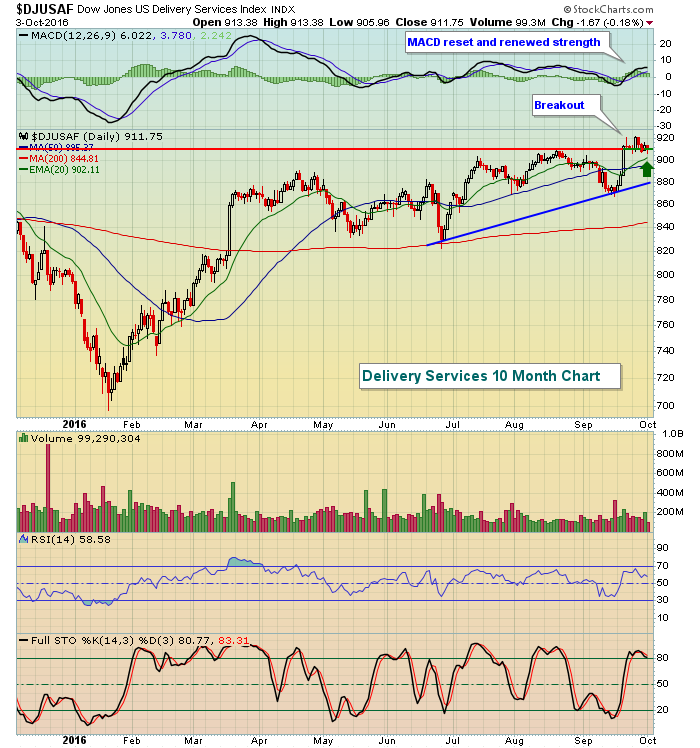 Price support has been holding for the past several trading sessions, but even if that fails short-term, the rising 20 day EMA (green arrow) and trendline support should provide other opportunities for buyers to step in.
Historical Tendencies
One of the strangest historical tendencies occurs in the first week of October. Usually a very bullish period as money inflows drive prices higher, the first nine calendar days of October produce annualized returns of -20.00% since 1987 on the Russell 2000. Why are small caps so bearish to open October? I'm not sure, but here are the annualized returns by day:
October 1: -18.66%
October 2: -73.98%
October 3: -128.90%
October 4: +79.23%
October 5: +9.09%
October 6: -19.59%
October 7: -196.25%
October 8: -65.10%
October 9: -196.95%
There's no other calendar month that starts so bearishly on any of our major indices and Monday began October 2016 on a sour note as the Russell 2000 fell 0.47%.
Key Earnings Reports
(actual vs. estimate):
DRI: .88 vs .83
(reports after close, estimate provided):
MU: (.09)
Key Economic Reports
None
Happy trading!
Tom
