Market Recap for Friday, September 30, 2016
Financial (XLF, +1.37%) and energy (XLE, +1.36%) shares paced Friday's advance to close out September on a very strong note for U.S. equities. Like most of the summer, September was a bifurcated month, one in which two sectors - technology (XLK, +2.05%) and energy (+1.93%) - performed extremely well on a relative basis while many other sectors - led by financials (-2.54%) and materials (XLB, -2.15%) - lagged. The good news for the bulls I suppose is that September - historically recognized as the worst calendar month of the year - held up well with the S&P 500 shedding just two points despite entering the month with a negative divergence on its daily MACD.
The 10 year treasury yield ($TNX) jumped on Friday to just above the 1.60% level and that sent money flowing into key areas withing financials, like banks ($DJUSBK), investment services ($DJUSSB) and asset managers ($DJUSAG), the latter of which is reviewed in the Sector/Industry Watch section below. The direction of treasury yields will likely have a significant impact on many other asset classes and Friday's TNX finish at 1.60% is literally on a pivotal area as reflected in the chart below:
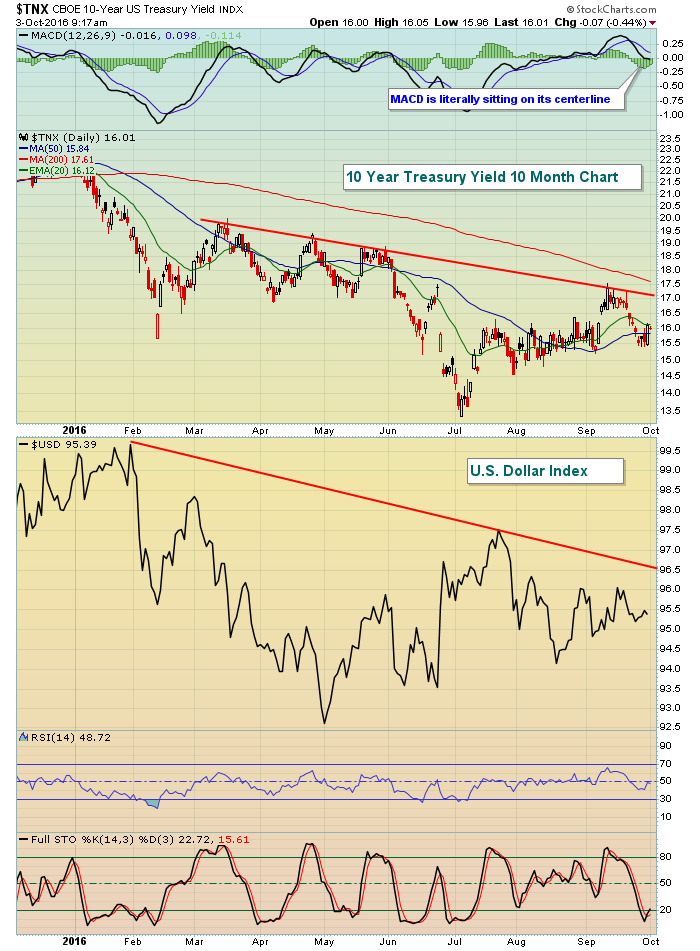 You can see from the above that the U.S. dollar has a fairly strong tendency to move in lockstep with the TNX so figuring out the direction of interest rates will also help figure out the dollar.......and gold (GLD), which generally moves opposite the dollar. A break above the falling trendline on the TNX would be bullish for the dollar and bearish for gold.
The rise in the TNX kept pressure on utilities (XLU, -0.69%) for a fifth consecutive session.
Pre-Market Action
Global markets are mostly higher with the Tokyo Nikkei ($NIKK) and Hong Kong Hang Seng ($HSI) performing quite well overnight while the London Financial Times ($FTSE) is up more than 1% this morning. Crude oil prices ($WTIC) have been trending higher and are once again approaching $50 per barrel. Remember there's a bullish reverse head & shoulders pattern that confirms on a breakout above $52 per barrel. As a result, the energy space (XLE) continues to outperform the benchmark S&P 500 and remains a must own sector - at least for now.
U.S. futures are down slightly as the consolidation range on the S&P 500 from 2120-2190 extends into another week.
Current Outlook
There remain many conflicting signals as to market direction right now. The most reliable indicator, however, is the combination of price and volume and when I look at a long-term weekly chart of the Russell 2000, I see a very bullish inverse head & shoulders pattern in play with a target of 1450, or another 200 point rise (approx +17% from current price). Take a look at this pattern:
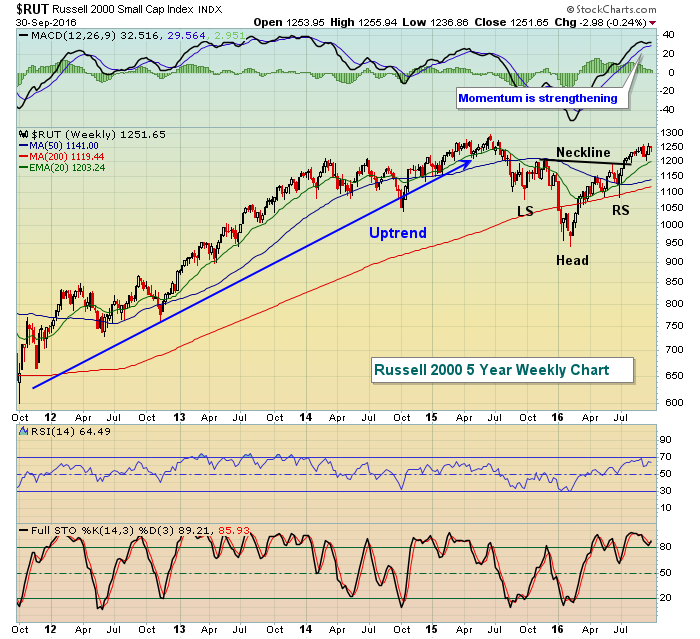 The "measurement" of an inverse head & shoulders pattern is calculated by subtracting the price at the inverse head from the price at the neckline. That difference of roughly 250 points is added to the breakout of the neckline (1200) to determine the "target" of 1450. Should this pattern play out, a rise in the Russell 2000 would likely coincide with considerable improvement in the outlook of the U.S. economy.
Sector/Industry Watch
Asset managers ($DJUSAG) recovered nicely on Friday.....and on accelerating volume to boot. This is a group that normally moves higher during treasury selloffs (and rising yields). The 10 year treasury yield jumped back above 1.60% Friday, gaining more than 5 basis points in the process. That began a recovery in many financial industry groups, including the DJUSAG. A key price resistance level isn't far off and a breakout should be respected. Take a look:
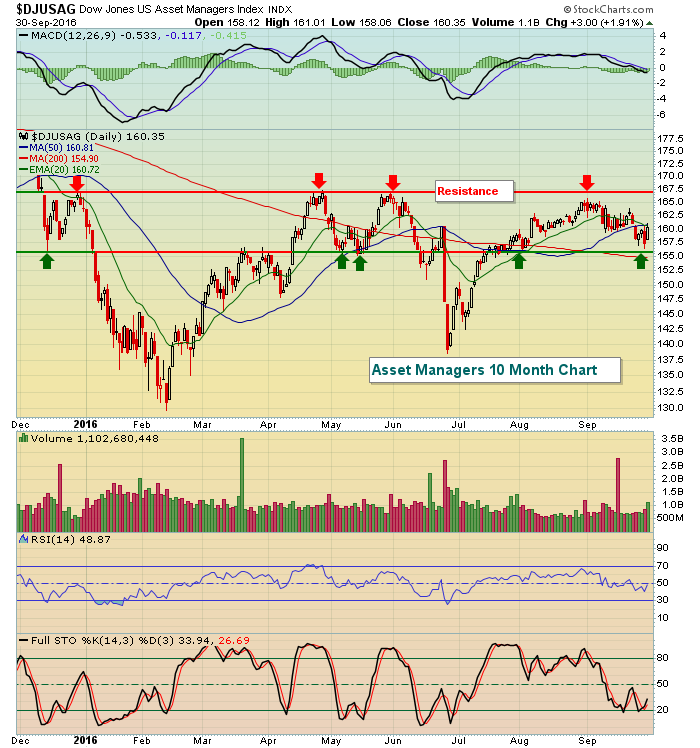 The 156-167 range has proven to be quite difficult to penetrate. 167 has been tested from underneath on multiple occasions since late December 2015 so an eventual breakout would likely lead to accelerating bullish action.
Monday Setups
I typically try to find companies that have recently reported strong quarterly revenues and EPS - beating Wall Street estimates - but have pulled back and are testing key price, gap, trendline, moving average, etc. support with momentum indicators like RSI in a very palatable entry area like 40-50. There are a few companies like that and I'll discuss those during my Trading Places LIVE webinar at 1pm EST today. You can register for this webinar by CLICKING HERE.
Here's an example of what I look for:
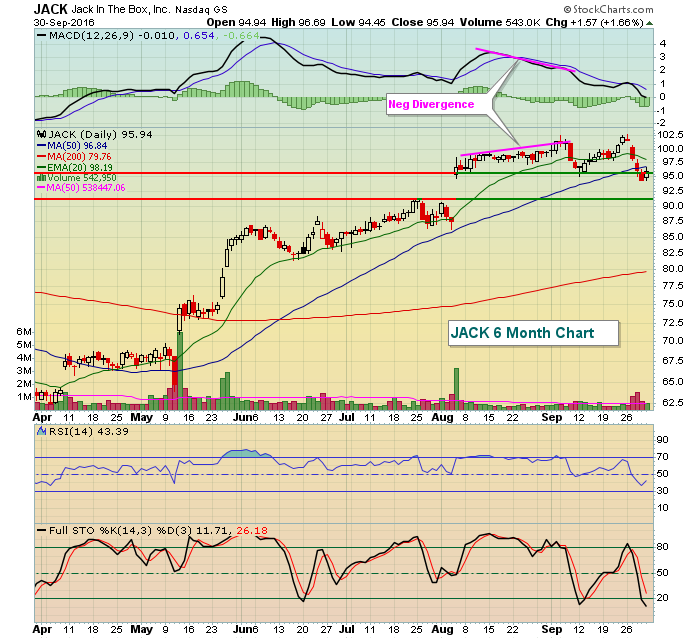 JACK posted excellent quarterly results in early August and gapped higher, but eventually printed a negative divergence as bullish momentum waned. From that point forward, JACK has been downtrending and its RSI has fallen from nearly overbought close to 70 down to its current level of 43. The horizontal lines on the chart highlight key support levels so activity within this zone represents solid reward to risk levels.
This chart, along with others, will be discussed during my webinar this afternoon. Please feel free to join me using the link provided above.
Historical Tendencies
October gets a bad rap. While it has been home to some of the biggest declines in stock market history, it typically is quite bullish and one reason why the "go away in May" crowd gets it wrong. That theory suggests that you leave the stock market on April 30th and return on November 1st. The problem is that October has been the best performing calendar month over the past 20 years, averaging monthly gains of 2.1% on the S&P 500 over that period.
Key Earnings Reports
None
Key Economic Reports
September ISM manufacturing index to be released at 10:00am EST: 50.2 (estimate)
August construction spending to be released at 10:00am EST: +0.3% (estimate)
Happy trading!
Tom
