Market Recap for Thursday, October 27, 2016
All of our major indices were fractionally lower to end the historically bearish October 22nd-27th period. Treasury yields were on the rise as the 10 year treasury yield ($TNX) broke above 1.80% to continue its recent uptrend. Selling in treasuries sent the yield higher and also provided a boost for certain interest-rate sensitive areas of the market like banks ($DJUSBK) and life insurance ($DJUSIL). Healthcare (XLV, +0.46%) was the best performing sector as it simply bounced off a price support with momentum indicators oversold. Check out the sector:
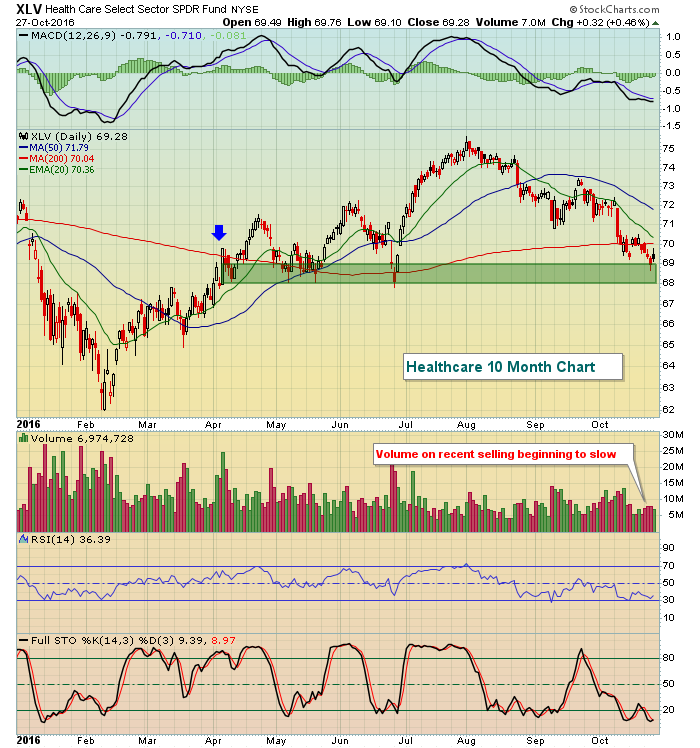 Price momentum is accelerating to the downside as the lower MACD reflects. But the RSI and stochastic both show oversold conditions so a bounce now or in the near-term is to be expected. The declining 20 day EMA is your key resistance to watch while we could see a positive divergence form soon. If that were to occur at price support, it would represent a very solid reward to risk entry into the sector.
Financials (XLF, +0.25%) were the next best sector on Thursday and that seems reasonable given the breakout in the TNX. The DJUSIL printed a bullish piercing candlestick on Wednesday, indicative of further short-term strength to come and we saw that yesterday as treasury yields rose. Check out the DJUSIL:
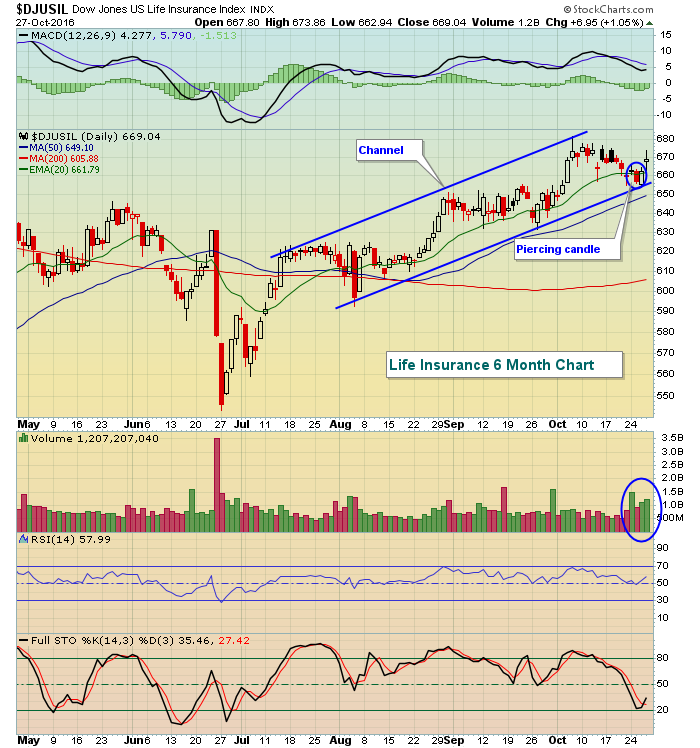 Given the bullish outlook on treasury yields, I'd expect to see relative strength in life insurance and banks throughout the balance of 2016.
Pre-Market Action
Amazon.com (AMZN) and Alphabet (GOOGL) both reported their quarterly results last night after the closing bell. Traders were not happy with AMZN as the stock is down more than 5% as it sets for a new trading day. GOOGL is up, but only by 1% as futures are up slightly this morning. At last check the Dow Jones futures are up 22 points.
Current Outlook
The 10 year treasury yield ($TNX) made the breakout above 1.80% and the interest-sensitive groups expected to rise did, in fact, rise. Because this latest breakout suggests even higher yields down the road, it should make sense that financials will be one of the groups to lead into year end and we're already seeing that on the following absolute and relative chart:
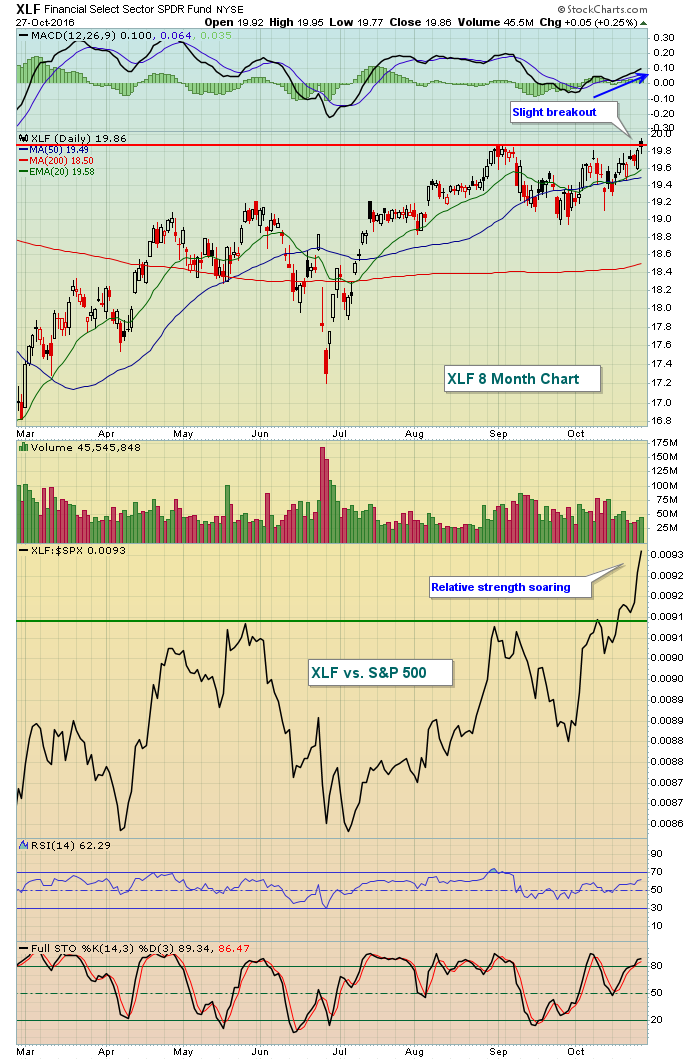 The blue arrow shows the MACD gaining price momentum at a time when the XLF is just breaking above price resistance. The relative chart vs. the benchmark S&P 500 shows enormous demand for financial stocks as yields rise and many bank and life insurance earnings reports come in ahead of consensus estimates. Consider using pullbacks to enter into these financial areas in the days ahead.
Sector/Industry Watch
The Dow Jones U.S. Clothing & Accessories Index ($DJUSCF) has been one of the worst industry groups over the past three months and are certainly a drag on the consumer discretionary sector (XLY). The group is approaching a very significant long-term price support area and November represents one of the best calendar months for clothing from a seasonal perspective (February through April is clearly the best stretch). Here's a look at the current technical indications:
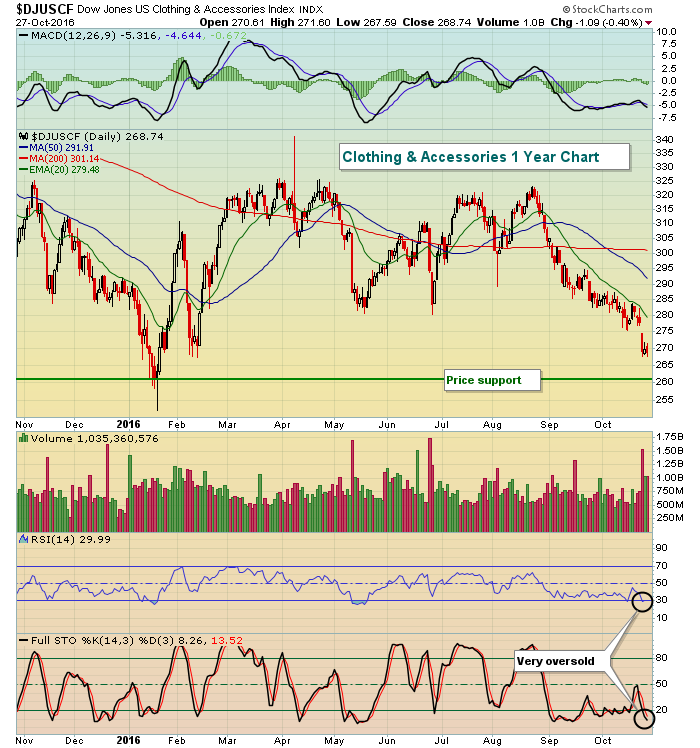 The DJUSCF is very oversold and I'd expect to see buyers emerge if the 260 price support is tested. From 260, perhaps we'd see a 5-6% bounce to the declining 20 day EMA.
Historical Tendencies
The best period during the year for U.S. equities, based on history, is from the close on October 27th to the close on January 19th. Since 1950, the S&P 500 has finished this period higher than it's started 56 times while falling just 10 times. From 1983 through 2015, this period ended higher 31 of 33 years, including 19 in a row at one point. The two down years? 2001 and 2008, both part of extended bear markets. This is just one more reason to remain on the long side of trades until, at a minimum, the S&P 500 breaks initial price support at 2120. Historically, the bulls are now clearly in charge.
Key Earnings Reports
(actual vs. estimate):
ABBV: 1.21 vs 1.21
ABEV: .06 vs .06
AON: 1.29 vs 1.28
BUD: .83 vs 1.19
CVX: .68 vs .39
E: (.31) vs (.09)
HSY: 1.29 vs 1.18
MA: 1.08 vs .98
NVO: .58 vs .56
NWL: .78 vs .73
PSX: 1.05 vs .88
SNY: 1.00 vs .86
TOT: .84 vs .84
WY: .23 vs .22
XRX: .27 vs .27
Key Economic Reports
Q3 advanced GDP released at 8:30am EST: +2.9% (actual) vs. +2.5% (estimate)
October Michigan sentiment to be released at 10:00am EST: 88.2 (estimate)
Happy trading!
Tom


