Market Recap for Friday, October 28, 2016
Happy Halloween! Earnings season is well underway and it's clear that certain areas of the market are gaining momentum as a result. Those that benefit from higher interest rates are doing particularly well - both fundamentally and technically. Look no further than the financial sector (XLF, -0.45%) where we saw a breakout on Thursday followed by a successful test of its rising 20 day EMA on Friday. It was the second worst performing sector Friday, but the technical action of late has been very bullish and encouraging. Check out the chart:
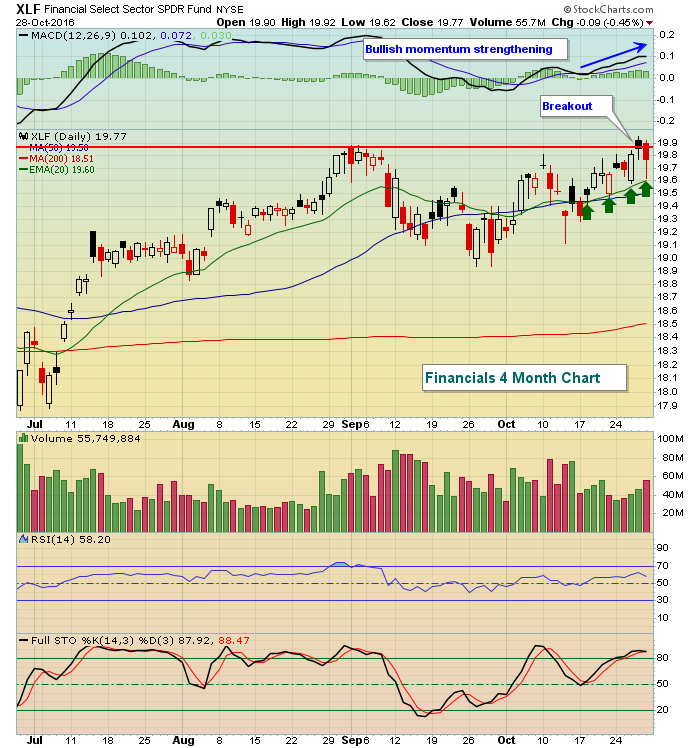 We've seen four tests of the rising 20 day EMA in the past two weeks and that's a sign of trending prices. Throw in the breakout on Thursday and the strengthening MACD and it's not difficult to see the merits of owning stocks in this space, particularly life insurance ($DJUSIL) and banks ($DJUSBK), both of which look quite strong technically on both an absolute and relative basis.
Pre-Market Action
Dow Jones futures are up 27 points this morning as the U.S. market attempts to bounce off support again. Stocks here will get little help from global markets as we're seeing a fairly weak open around the world - nothing terrible, just weak.
More of the second tier companies will be reporting this week. It's a heavy week of earnings, but most of the recognizable names have already reported and the U.S. market has held support. So I suppose we could say that's a bullish development. Prices don't lie though analysts might. :-)
Current Outlook
The S&P 500 again challenged the biggest price support level on the chart, at least on a short- to intermediate-term basis. The low on Friday was 2119 and 2120 has clearly been the level where the bulls have been able to regain control. While a breakdown doesn't guarantee further losses, it would certainly open the door to that. Check out the visual:
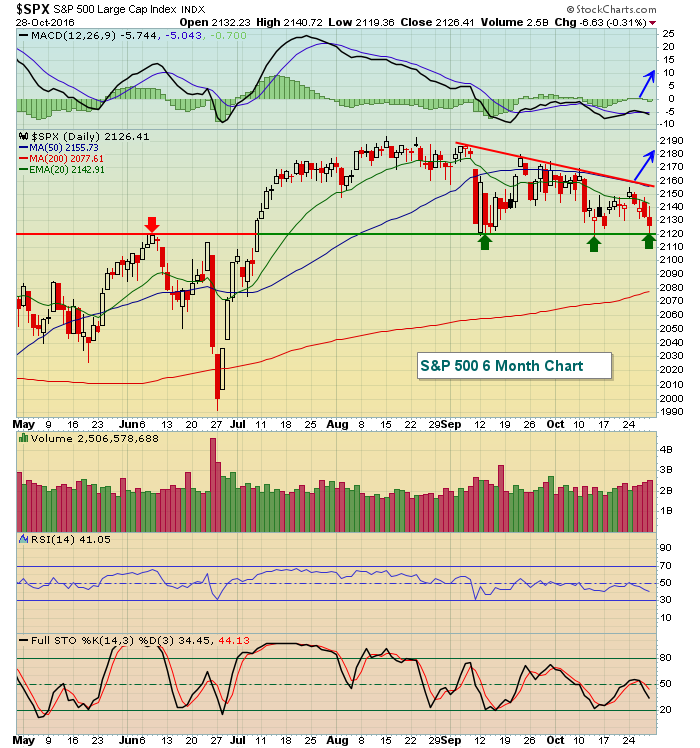 While 2120 is a key to the downside, I've marked two blue arrows to highlight what I'm looking for from a bullish perspective. A breakout above the recent downtrend line near 2155-2160 and a bullish MACD crossover the zero line would be a great start to further the 7 1/2 year bull market.
Sector/Industry Watch
The Dow Jones U.S. Home Construction Index ($DJUSHB) finally printed a reversing candle on Friday after its lengthy downtrend. Reversing candles are only short-term signals, sometimes last just a day or two. So here is the current technical picture to determine when the bounce is likely to be more than just a bounce:
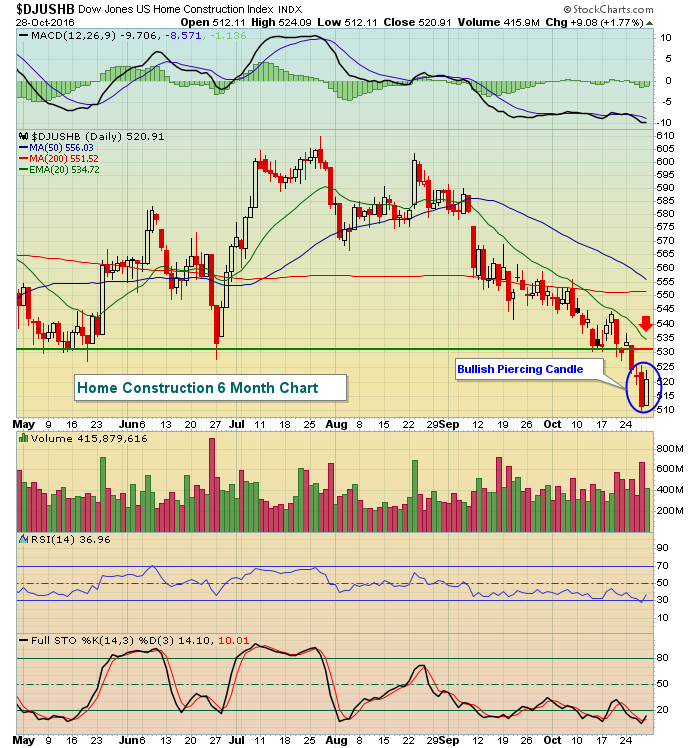 The DJUSHB recently broke down and may not have run its course to the downside as there's not much price support on the longer-term chart until it reaches 460. However, November starts a very bullish period historically so it's at least worth looking at. Initial price resistance should be felt near 531 and the declining 20 day EMA, currently at 535, also could produce more sellers.
Monday Setups
I generally provide a stock trading setup here each Monday, with additional information and additional setups provided during my Trading Places LIVE webinar, which begins at 1pm EST every Monday. If you'd like to check out the webinar, you can do so by REGISTERING HERE. Hope to see you later today!
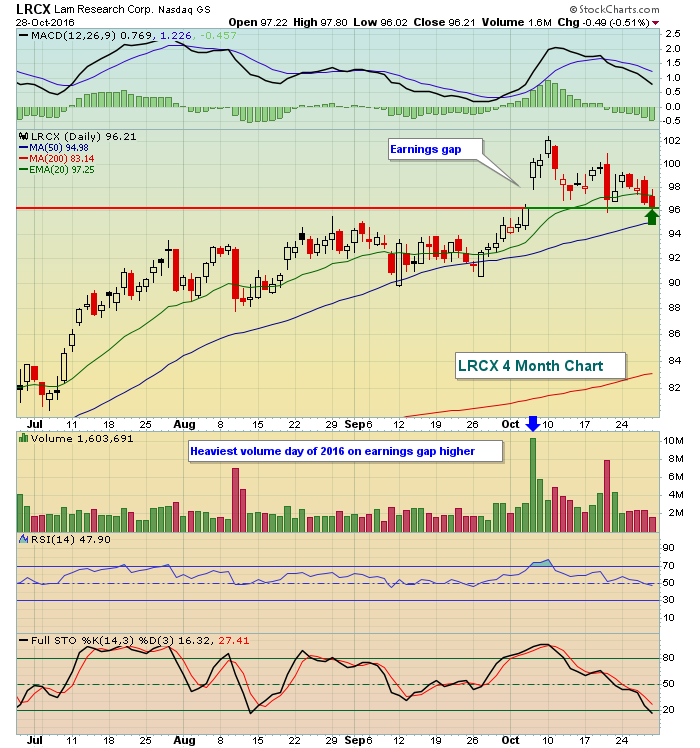
For this week, consider the prospects of semiconductor company Lam Research (LRCX), which recently skimmed past Wall Street revenue estimates and produced better than expected EPS as well (1.81 vs 1.77). Further, after gapping higher, LRCX has returned to gap support and I expect it to resume its uptrend from here - or possibly the rising 50 day SMA, which is also quickly approaching. Take a look:
 I'll discuss this chart and a couple others in more detail during my webinar later today. Again, please join me!
Historical Tendencies
The 31st day of the calendar month produces historically bullish results. Prices typically move higher as a result of window dressing by portfolio managers in addition to the general buying of equities prior to incoming money flows early in the next calendar month. Below are the annualized returns on the 31st day of the month by major index:
S&P 500 (since 1950): +30.48% (trails only the 1st, 2nd and 16th days of the calendar month)
NASDAQ (since 1971): +49.88% (trails only the 1st calendar day of the month)
Russell 2000 (since 1987): +75.58% (best day of the calendar month)
Key Earnings Reports
(actual vs. estimate):
CAH: 1.24 vs 1.21
CHKP: 1.01 vs .97
CNA: 1.15 vs 84
COL: 1.58 vs 1.57
D: 1.14 vs 1.04
L: .97 vs .69
NEE: 1.74 vs 1.65
PEG: .88 vs .81
ROP: 1.65 vs 1.62
SO: 1.28 vs 1.17
WMB: .20 vs .16
ZBH: 1.79 vs 1.79
(reports after close, estimate provided):
APC: (.57)
GGP: .35
TSO: 1.42
VNO: 1.28
Key Economic Reports
September personal income released at 8:30am EST: +0.3% (actual) vs. +0.4% (estimate)
September personal spending released at 8:30am EST: +0.5% (actual) vs. +0.5% (estimate)
October Chicago PMI to be released at 9:45am EST: 54.3 (estimate)
Happy trading!
Tom


