Market Recap for Tuesday, November 15, 2016
In my blog article yesterday morning, I pointed out that both crude oil ($WTIC) and internet stocks ($DJUSNS) hit significant price support. In the case of the WTIC, there was a big reversal in place that suggested we'd see continuing strength and that energy (XLE, +2.82%) could be a big beneficiary. It was. Furthermore, the DJUSNS had finally tested key price support at the 1100 level, where we saw a major breakout above price resistance in July. Here's a long-term weekly visual into the internet space:
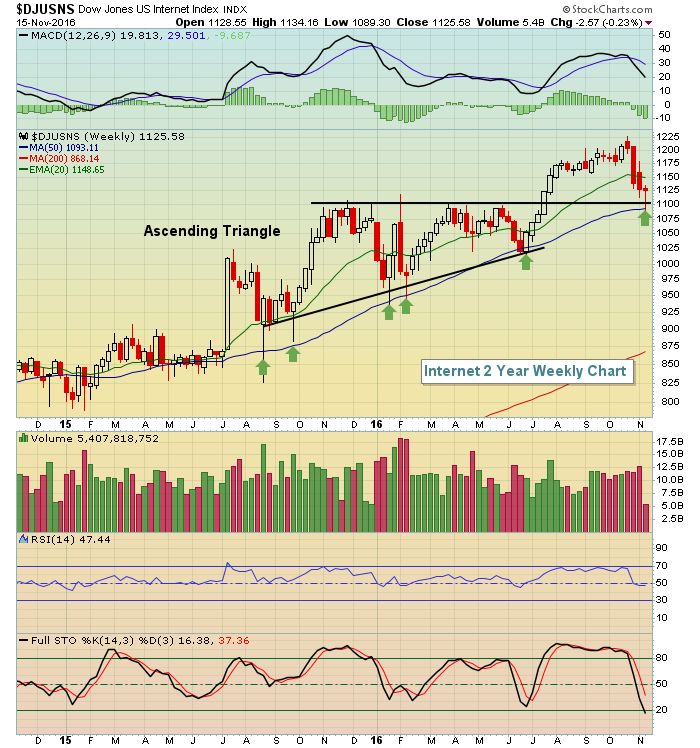 We saw a very bullish breakout of an ascending triangle in July and Monday's weakness was nothing more than a test of price support - at least thus far. The green arrows also show that the DJUSNS has bounced every time it's fallen to its rising 50 week SMA. Also, weekly RSI readings in the 40-50 range have marked intermediate-term bottoms.
On a relative basis, energy (XLE) rallied right on time. This sector has been outperforming all year and I'm assuming that will continue - until it doesn't. Despite the recent weakness in crude oil prices, the XLE has held up quite well vs. the S&P 500 as reflected below:
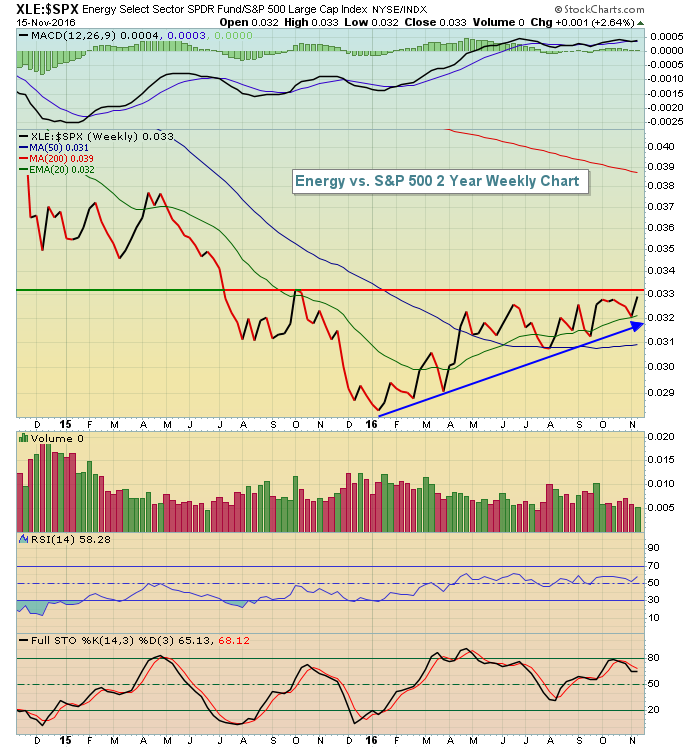 The XLE:$SPX ratio is nearing an important relative resistance level just above .03. A relative breakout there would suggest more relative strength ahead.
Pre-Market Action
The 10 year treasury yield ($TNX) is extending its recent hot streak as the TNX has moved up to 2.28% at last check. This rise will most likely result in yet another push higher in financial stocks (XLF) today while dividend payers like consumer staples (XLP) and utilities (XLU) suffer on a relative basis.
Lowe's (LOW) and Target (TGT), two large retailers, reported quarterly results this morning on opposite ends of the spectrum. LOW missed consensus estimates with actual EPS of .88 vs. .96. LOW is down nearly 5% in pre-market. TGT, however, blew away estimates with actual EPS coming in at 1.04 vs. .83 consensus estimate. TGT is higher by 7.5% at last check in pre-market trading.
Asian stocks were mixed overnight, but we're seeing mostly across-the-board weakness in Europe. That's led to weakness here in U.S. futures. With 30 minutes left before the start of another trading day, Dow Jones futures are lower by 55 points.
Current Outlook
The rally is beginning to look a little stretched and overbought so taking some profits might make some sense. I believe most signals are pointing to a continuing rally and a breakout on the S&P 500 to all-time highs. But first we may have to rectify short-term price momentum issues. Currently, we have negative divergences on the 60 minute charts of the Dow Jones, S&P 500 and Russell 2000. The Russell 2000, in particular, is extremely overbought on its hourly chart. Below, however, is the S&P 500's chart showing that a trip back to 2150 or so wouldn't be a bad thing technically. Take a look:
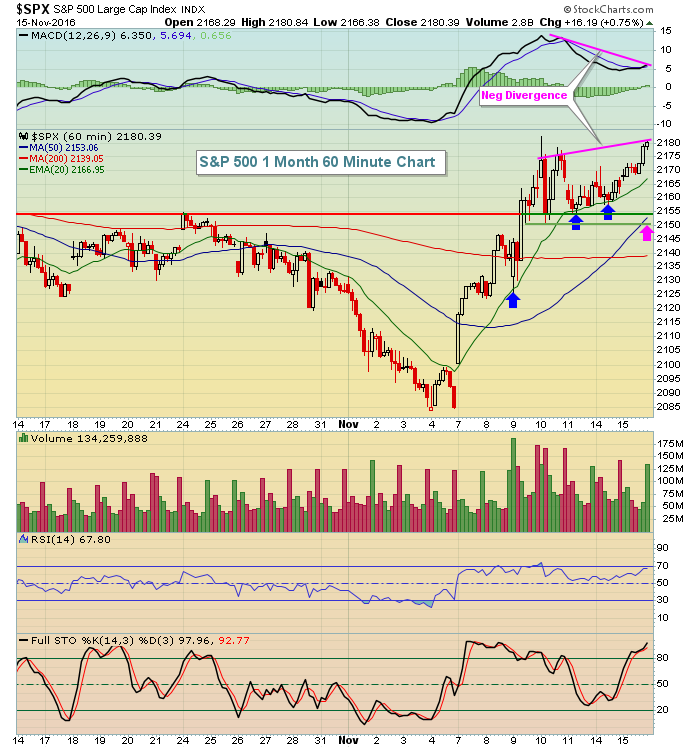 Note that during the current rally, the blue arrows mark multiple successful tests of the rising 20 hour EMA. Those tests occurred while the MACD was strong - moving up with each price high. This indicates that momentum is strong because the short-term (12 hour EMA) moving average is moving up faster than the longer-term (26 hour EMA) moving average. Typically, we see the rising 20 period EMA hold as support during such strong momentum moves. But on the last two price highs, compare the MACD levels and you'll see a negative divergence. The pink arrow now marks the potential of a 50 hour SMA test, which also happens to coincide with price support.
Sector/Industry Watch
The Dow Jones U.S. Semiconductors Index ($DJUSSC) has been very strong and appears poised to make yet another breakout in its continuing uptrend. However, there are price momentum issues brewing under the surface that you should be aware of. These "issues" relate mostly to the longer-term weekly charts and that suggests a longer period of consolidation, or even selling, ahead. We're not there yet, but watch the following closely:
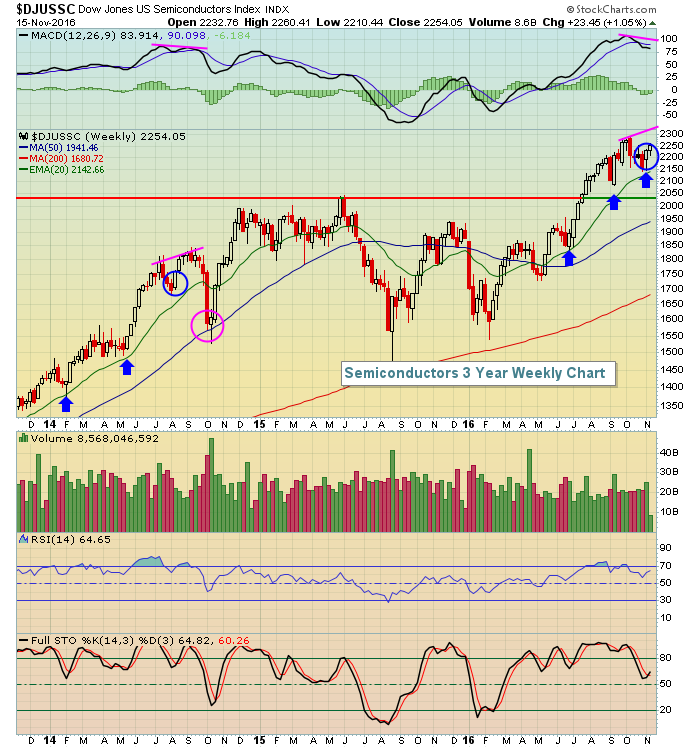 The technical action in the DJUSSC has been very bullish. Until now, this rally has been accompanied by higher prices and a rising weekly MACD, indicative of increasing bullish momentum. But as we turn higher off the 20 week EMA, note that the MACD is much lower than it was, essentially guaranteeing a lower MACD reading on the next price high. The current look of the chart is very similar to August 2014 and notice the next high generated the warning sign - a negative divergence. The DJUSSC then fell quickly to its 50 week SMA, which is what I look for when negative divergences present themselves. So if we see another breakout, make sure the breakout is held. Otherwise, I'd look for a steeper drop than the one we just saw. 1950-2025 would be the initial target area. I'm still bullish the group currently, just pointing out that the next price high could be an issue technically.
Historical Tendencies
November is not a great month historically for energy stocks as only two industry groups within the sector even show positive average monthly returns. Technically, however, energy looks strong. You might consider the coal group ($DJUSCL) as they have produced average November returns of 3.1% over the last 16 years. The fourth quarter has also been, by far, the best quarter of the year for coal. Here's the seasonality recap:
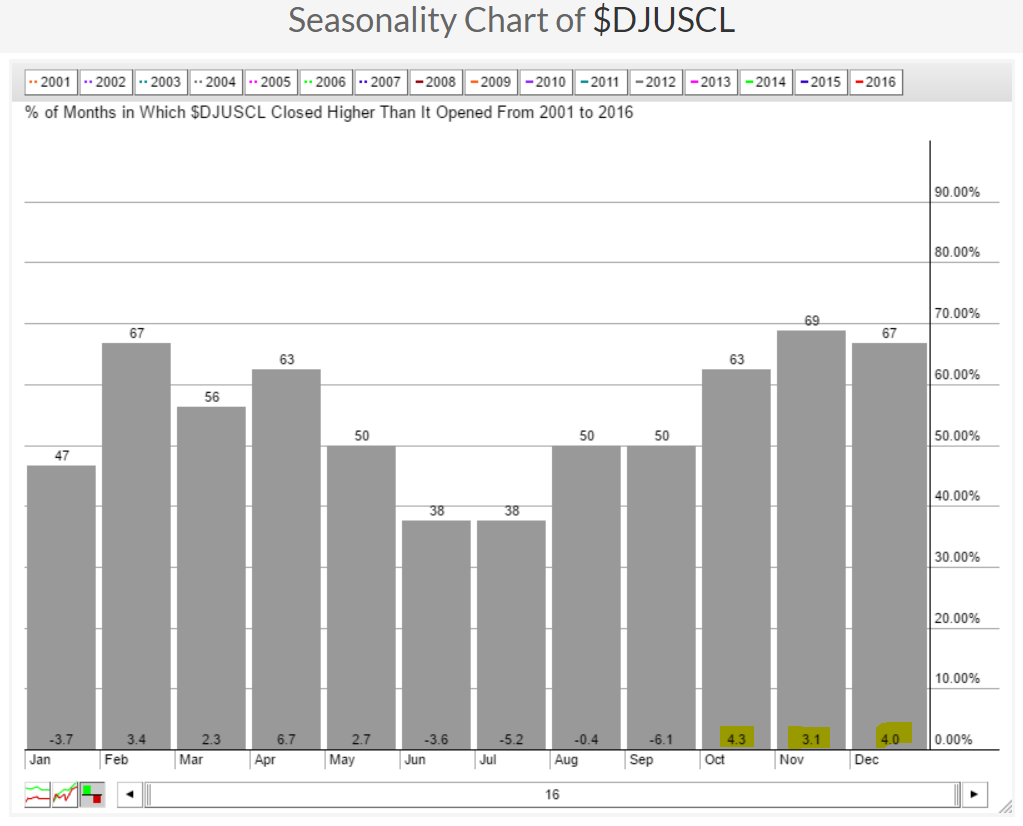 I've highlighted the average monthly returns in October, November and December. Those are strong seasonal returns. Now take a look at the current technical state:
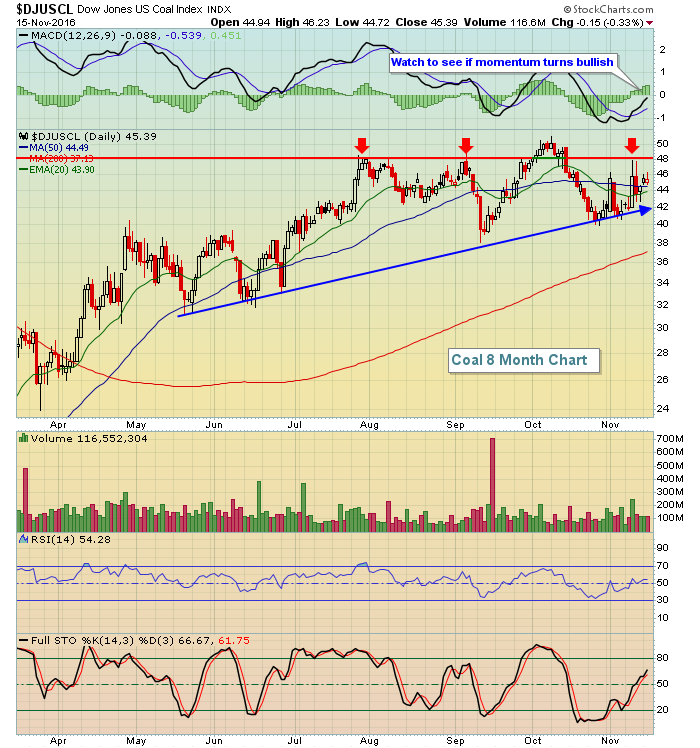 48 has marked resistance on several occasions so a push above that level, along with a bullish MACD crossover, would likely begin a fresh short-term uptrend.
Key Earnings Reports
(actual vs. estimate):
LOW: .88 vs .96
TGT: 1.04 vs .83
(reports after close, estimate provided);
CSCO: .54
LB: .40
NTAP: .38
Key Economic Reports
October PPI released at 8:30am EST: +0.0% (actual) vs. +0.3% (estimate)
October Core PPI released at 8:30am EST: -0.2% (actual) vs. +0.2% (estimate)
October industrial production to be released at 9:15am EST: +0.1% (estimate)
October capacity utilization to be released at 9:15am EST: 75.4% (estimate)
November housing market index to be released at 10:00am EST: 63 (estimate)
Happy trading!
Tom


