Market Recap for Wednesday, November 16, 2016
Computer hardware ($DJUSCR) led a tech-fueled rally on Wednesday that resulted in bifurcated action in our major indices. The NASDAQ finished with a nice 0.36% gain while the Russell 2000 was flat and the Dow Jones and S&P 500 ended with losses of 0.29% and 0.16%, respectively. The NASDAQ's outperformance of the Dow Jones throughout this bull market is quite apparent and I've included it in the Current Outlook section below. Yesterday, it was Apple's (AAPL) turn to lead. AAPL remains in a longer-term bullish inverse head & shoulders pattern and the low on Wednesday may have just marked a very important bottom - especially with the next couple months being so bullish historically. Here's the weekly AAPL chart:
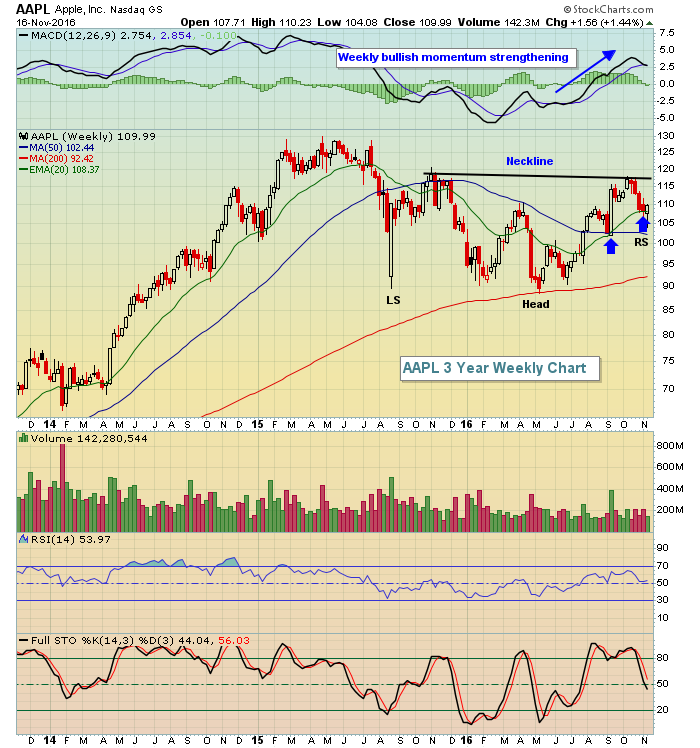 In all honesty, this inverse head & shoulders pattern is sloppy and not easy to recognize. For a pattern to play out, it's best if it can be recognized by traders. In addition to the sketchy inverse H&S pattern, however, we've seen a bullish MACD crossover and the recent lows have held rising 20 week EMA support (blue arrows). This week's candle currently is a hammer, although we still have two days of action before the final weekly candle prints. But that current candle is bullish and AAPL's weekly volume is likely to be its highest since September.
Treasuries remain under intense pressure and the corresponding yields won't seem to fall back. There is a potential topping pattern in play on the 10 year treasury yield ($TNX), however. Should we see a gap down in the TNX, there'd be an island cluster reversal printing and a likely short-term top. On a pullback, consider the rising 20 day EMA as key support. Here's the chart:
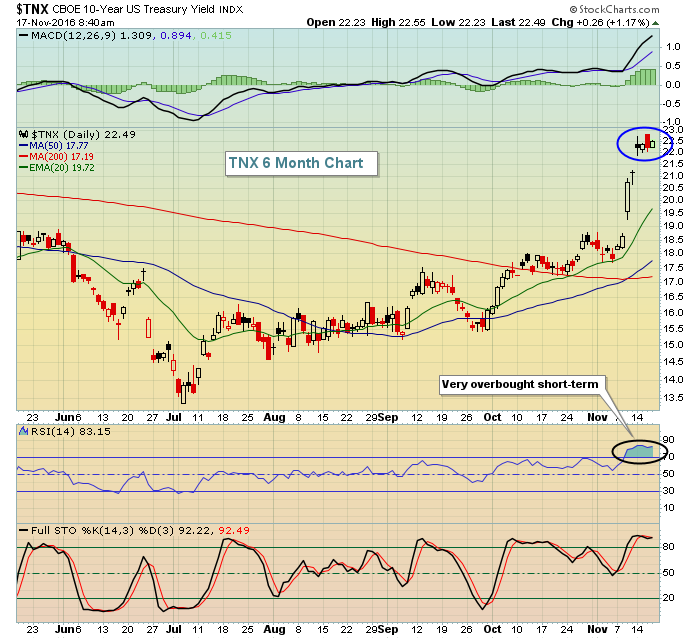 The blue circle highlights the "cluster" of candles that follow an extended uptrend. This island cluster forms if we see a gap down below the cluster. That leaves these candles on an "island" and many times will mark a short-term top that's followed by at least a near-term downtrend. Should that occur, I'd expect to see support marked in the 1.95%-2.00% area.
Pre-Market Action
Wal-Mart (WMT) beat consensus estimates on its quarterly earnings (.98 vs .96), but the stock is down in pre-market action this morning. There are many economic reports out this morning, with jobless claims down significantly while housing starts and building permits both came in much better than expected.
Crude oil prices ($WTIC) are up 1.27% at last check this morning and that should bode well for the energy sector again today. Global markets were mostly mixed and near their respective flat lines. That's led to little movement in U.S. futures as the Dow Jones futures are down 7 points with 30 minutes left to the opening bell.
Current Outlook
One bullish signal is to witness market participants investing/trading with a "risk on" mentality. If traders begin to lose interest in riskier investments, it's a signal of rising fear and that's an environment for consolidation, or worse, bear markets. The following is a long-term weekly chart showing the relative performance of NASDAQ stocks vs. the safer Dow Jones:
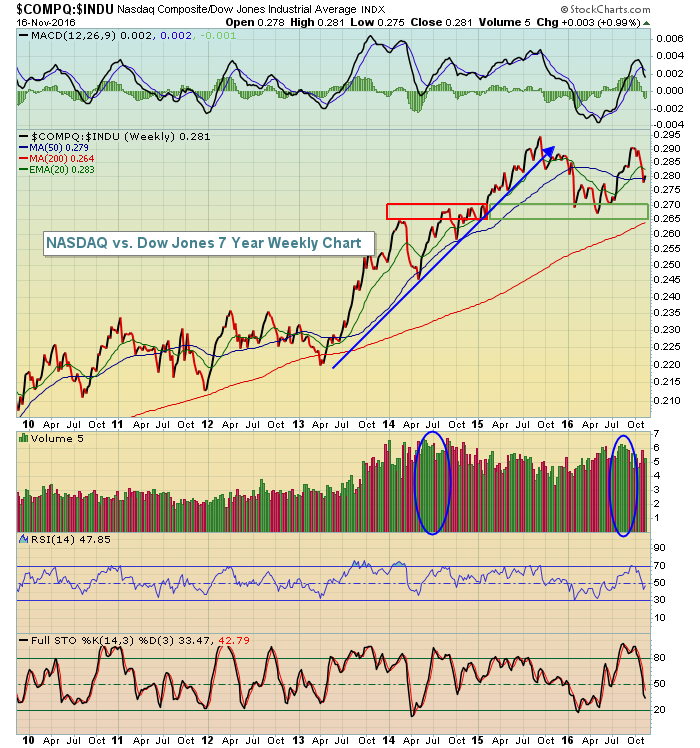 The S&P 500 gained more than 40% during 2013 and 2014 and if you look at the above chart, you'll see that the NASDAQ soared relative to the Dow Jones during those two years and into 2015. Since then, it's been choppier, but let's give the NASDAQ a break. That tech-laden index rose in parabolic fashion vs. the Dow Jones and deserved a period of relative consolidation - at a minimum. We appear to have started a fresh period of outperformance (since early April) and the bounce the past couple trading sessions in the NASDAQ is helping it hold its relative uptrend line vs. the Dow Jones over the past six months.
Relative resistance formed in the latter half of 2014 in the .265-.270 range. We saw that relative resistance level give way in 2015 and we tested what became relative support in the first half of 2016. Traders now seem to be more willing to take on risk now and that's a good sign. Watch relative support at .265 and relative resistance at .295. Whichever level breaks first is likely to send us our longer-term directional signal. My guess is we see a breakout to the upside.
Sector/Industry Watch
The Dow Jones U.S. Medical Supplies Index ($DJUSMS) was the best performing industry group within the healthcare sector yesterday, but the question is....is this the right shoulder in a topping head & shoulders pattern or is this simply consolidation unwinding recent overbought conditions before the next breakout? You be the judge:
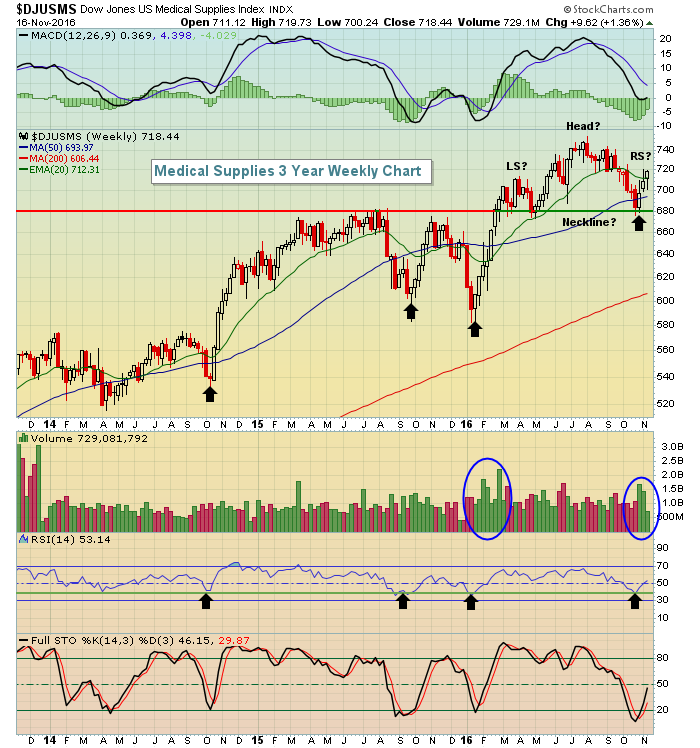 As the recent price low, RSI had dipped back to 40. You can see from the black arrows above that every time in the past three years that the weekly RSI has touched 40, we've marked a significant bottom. This last trip to RSI 40 accompanied a test of price support at 680. This is an important price low so beware a breakdown here. In the meantime, I'd look for another push towards 745-750.
Historical Tendencies
We are approaching a VERY bullish historical period on the S&P 500. Since 1950, the S&P 500 has moved higher from the November 20th close (this year November 18th close since the 20th falls on a Sunday) to the December 6th close 49 times out of the last 66 years. This rally around the Thanksgiving holiday has produced an annualized return of 31.37%, which is more than 3 times the 9% average annual returns the S&P 500 has enjoyed over these 6+ decades. This history doesn't mean we can't go lower, but it certainly favors the bulls as technical conditions continue to improve.
Key Earnings Reports
(actual vs. estimate):
BBY: .62 vs .47
HP: (.33) vs (.43)
SJM: 2.05 vs 1.94
SPB: 1.31 vs 1.29
SPLS: .34 vs .34
WMT: .98 vs .96
(reports after close, estimate provided):
AMAT: .65
CRM: .03
GPS: .60
INTU: (.17)
MRVL: .05
NUAN: .25
ROST: .56
Key Economic Reports
Initial jobless claims released at 8:30am EST: 235,000 (actual) vs. 257,000 (estimate)
October CPI released at 8:30am EST: +0.4% (actual) vs. +0.4% (estimate)
October Core CPI released at 8:30am EST: +0.1% (actual) vs. +0.2% (estimate)
October housing starts released at 8:30am EST: 1,323,000 (actual) vs. 1,168,000 (estimate)
October building permits released at 8:30am EST: 1,229,000 (actual) vs. 1,190,000 (estimate)
November Philadelphia Fed Survey released at 8:30am EST: +7.6 (actual) vs. +8.0 (estimate)
Happy trading!
Tom


