Market Recap for Tuesday, November 8, 2016
The U.S. stock market paused on Tuesday, awaiting results from the U.S. Presidential election. All nine sectors did manage to finish in positive territory but gains were fairly minimal. The NASDAQ outperformed, rising 0.53% but on just 1.7 billion shares. That was the lightest volume in the past six trading sessions and considering the S&P 500 had just broken back above key 20 day EMA resistance, it would have been much more bullish to see higher volume accompany yesterday's advance. Still, a gain is a gain and the alternative of failure and reversal at that 20 day EMA would have been quite bearish. Here's a look at the latest S&P 500 daily chart:
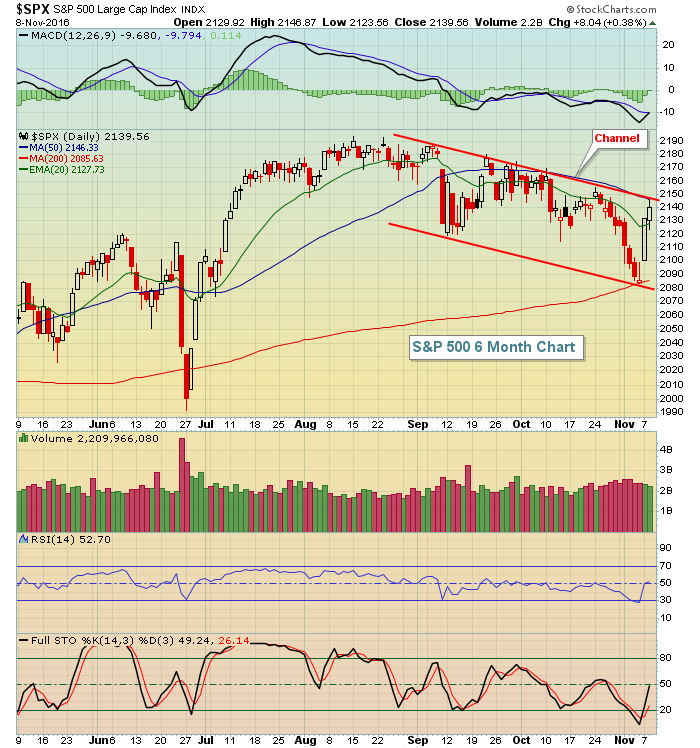 While the recovery the past two sessions has been a huge relief from a bullish perspective, the above chart highlights the short-term technical issues that the bulls faced - even before last night's stunning presidential upset. The channel in play for the last three months continues to be problematic. Also notice that recent 50 day SMA tests have proven difficult to overcome. The first key technical breakout would be a close above the 50 day SMA and a close that breaks channel resistance simultaneously. And high volume on the breakouts would be even more bullish. But short-term, the bears remain in control and the open this morning will likely see a move lower, perhaps approaching channel support. It's very difficult to predict the stock market's reaction today so stay tuned.
Utilities (XLU, +0.78%) were the best performing sector on Tuesday as traders opted for a bit of safety ahead of the election results. Higher treasury yields have dampened the enthusiasm for utility stocks, but the longer-term uptrend in the group remains. Therefore, if the stock market struggles in the days and weeks ahead, you might see money rotate towards this defensive area. Check out the longer-term weekly chart:
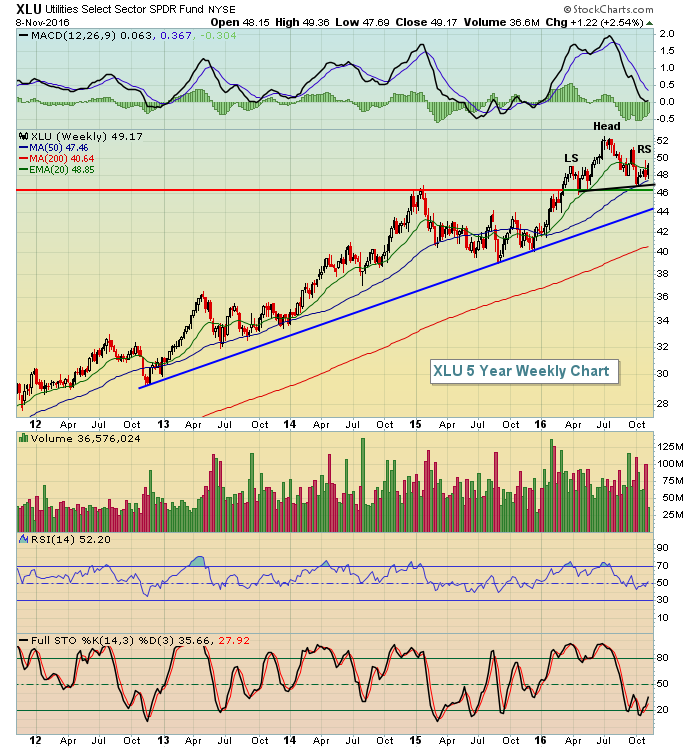 The XLU has very significant support near 46. That's not only price support, but it's also neckline support of a potential topping head & shoulders pattern. Again, let's see how things develop today.
Pre-Market Action
Global stock markets plunged overnight, but have recovered well off earlier lows. Markets are attempting to decipher the impact of a Trump presidency as most market participants had agreed previously that it was much more likely to see a Clinton victory.
The Dow Jones futures suggest that we'll see a 250 point drop at the open, but that number is much better than what we were looking at overnight as the Dow Jones at one point looked like it might see an 800-900 point drop. Tokyo's NIKKEI ($NIKK) lost 5% overnight as Asian markets started the selloff.
There's been selling this morning in the 10 year treasury yield ($TNX) with that key yield soaring this morning to 1.95%, closing in on a key 2.00% yield resistance level. It will be interesting to see if the money fleeing treasuries flows into the stock market or if it simply remains on the sidelines - or looks for other defensive areas like gold.
Current Outlook
One chart to watch is the bearish setup on the NASDAQ 100 ($NDX). There's a potential topping pattern in play here with a head & shoulders formation. Take a look:
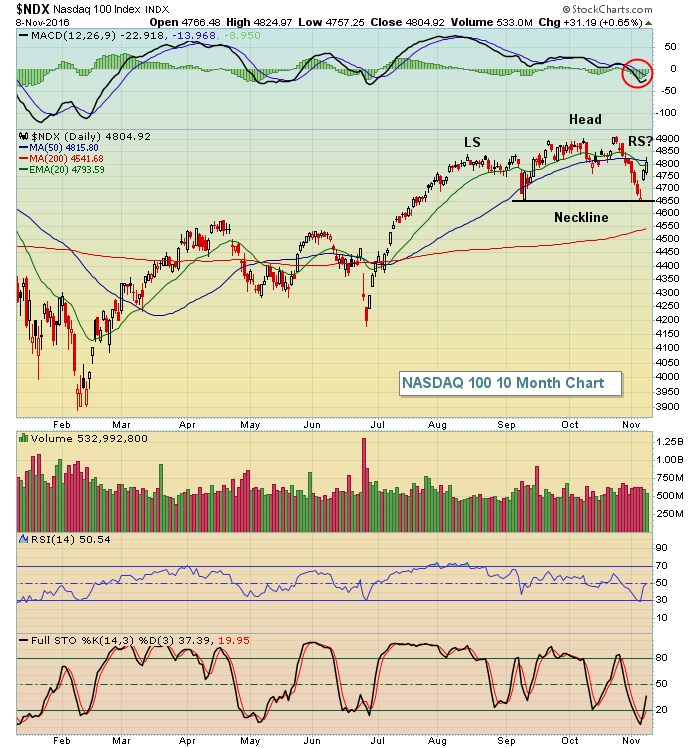 If short-term price weakness continues, please note that price momentum on the NASDAQ 100 is already weak and a major bearish technical pattern confirms on a high volume close beneath 4650.
Sector/Industry Watch
The Dow Jones U.S. Delivery Services index ($DJUSAF) broke out yesterday to a fresh high so if you're looking for recent strength and a solid technical pattern, look no further than this group. Check out the chart:
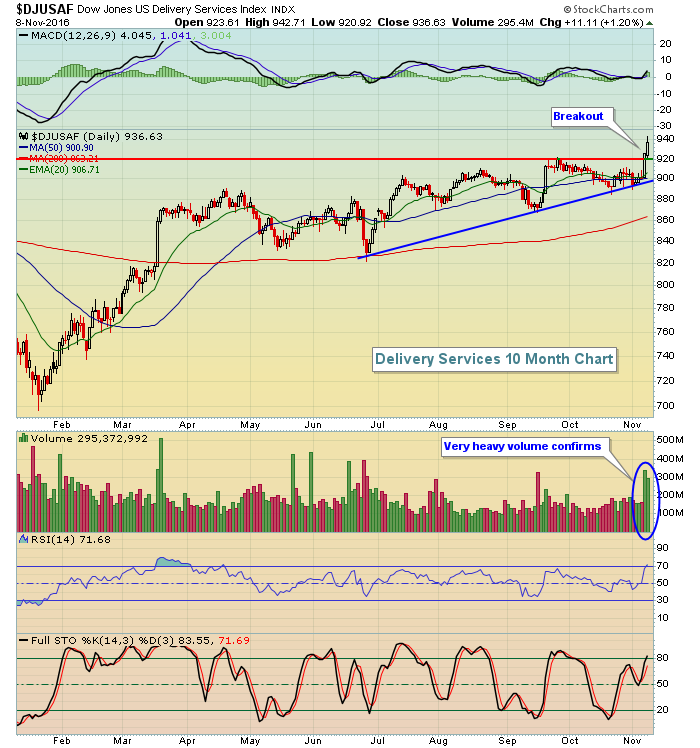 If the price breakout isn't enough to get you excited, then the volume to accompany the breakout should. This is a bullish space and an area to review on pullbacks.
Historical Tendencies
November 9th and 10th have been historically bearish on the NASDAQ and today looks to continue that trend - at least at the opening bell. The annualized returns for these two days are -21.37% and -32.21%, respectively.
Key Earnings Reports
(actual vs. estimate):
COTY: .23 vs .33
DISH: .64 vs .69
VIA: .69 vs .91
(reports after close, estimate provided):
ETP: .26
MYL: 1.50
NTES: 3.09
SLF: .70
Key Economic Reports
September wholesale inventories to be released at 10:00am EST: +0.2% (estimate)
Happy trading!
Tom
