Market Recap for Monday, November 7, 2016
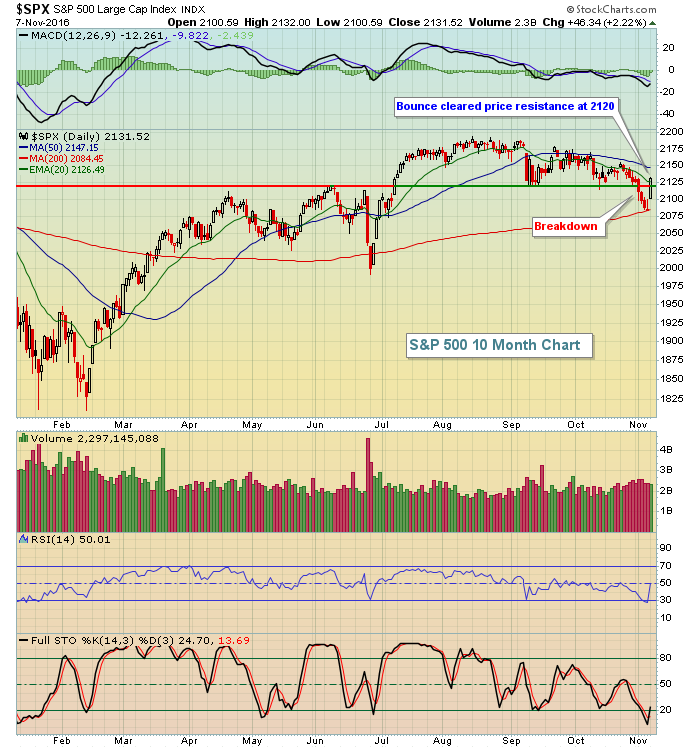
After nine consecutive losing sessions on the benchmark S&P 500, the bulls needed some relief and they woke up to it on Monday. U.S. futures were soaring and looking to erase several days of losses at the opening bell. While that was nice and it certainly stemmed the tide of recently selling, there's a lot of work to be done to restore the damage. First, the renewed buying doesn't change the fact that money has been rotating for 1-2 years away from aggressive areas so that needs to change. More importantly, however, the S&P 500 lost key price support at 2120 and was able to recover that level on Monday - but barely. Here was the recovery:
 Volume was moderate on the recovery, but there were positive signs. The aggressive area of healthcare (XLV, +2.56%) - biotechnology stocks ($DJUSBT) - had one of its best days of 2016 and the four aggressive sectors - financials (XLF, +2.51%), industrials (XLI, +2.46%), consumer discretionary (XLY, +2.31%) and technology (XLK, +2.17%) - all turned in solid performances and were the second through fifth best performing sectors. Clearly, traders were in a "risk on" mood and if that continues this bull market's not over. But it was only one day so the jury is still out. Check out the battle taking place in the biotech space:
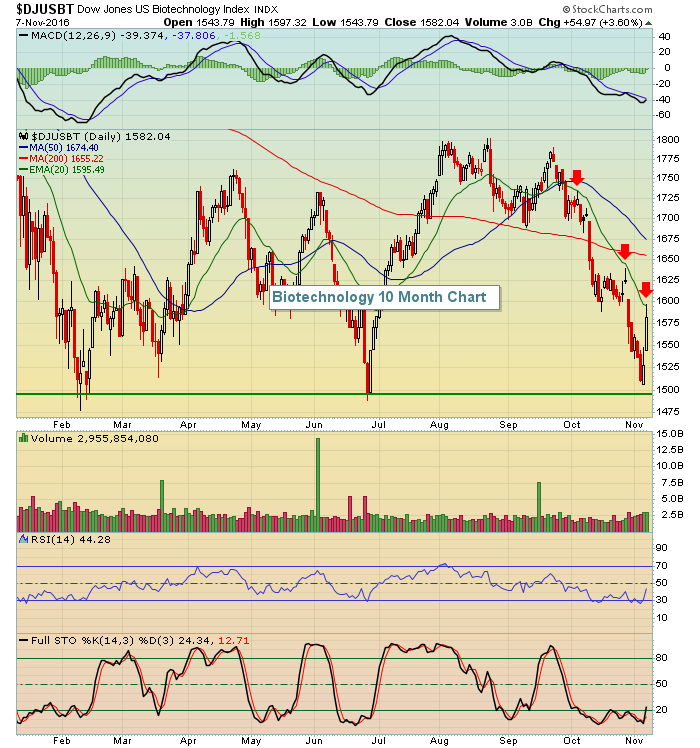 The green horizontal line marks 2016 price support which was nearly reached last week. The red arrows show the failure of the group to clear declining 20 day EMA resistance. For now, those are the two levels to watch - price support just below 1500 and resistance at the 20 day EMA. While Monday's action was nice, biotechs have much to prove as yesterday's advance may turn out to be nothing more than an oversold bounce off price support.
Pre-Market Action
Global markets (and U.S. futures) are pausing after big gains engulfed markets worldwide on Monday. The U.S. presidential election takes place today and traders are content to sit back and wait for results before committing to either the buy or sell side.
Current Outlook
We've been struggling for the past couple years to tack on any further gains during this bull market. Money just keeps rotating without any significant broad market advances. That's frustrated the bulls. And the bears are frustrated too as every breakout in the Volatility Index ($VIX) over the past couple years has failed to sustain the nervousness long enough for a bear market to set in. The past two bear markets never saw the VIX fall below the 16-17 level, but on every recent period of weakness where the VIX has soared above this 16-17 level, we've seen the market calm down and the VIX once again downtrend into bull market territory.
If you're in the bearish camp, it would be helpful to see the huge drop in volatility Monday (VIX, -16.88%) turn back higher before 16-17 support is lost. Of course every bear market can be different, but to me it makes sense that for prices to continue falling, expected volatility should remain high. Here's a chart to show that VIX rises with the weakness in S&P 500 prices:
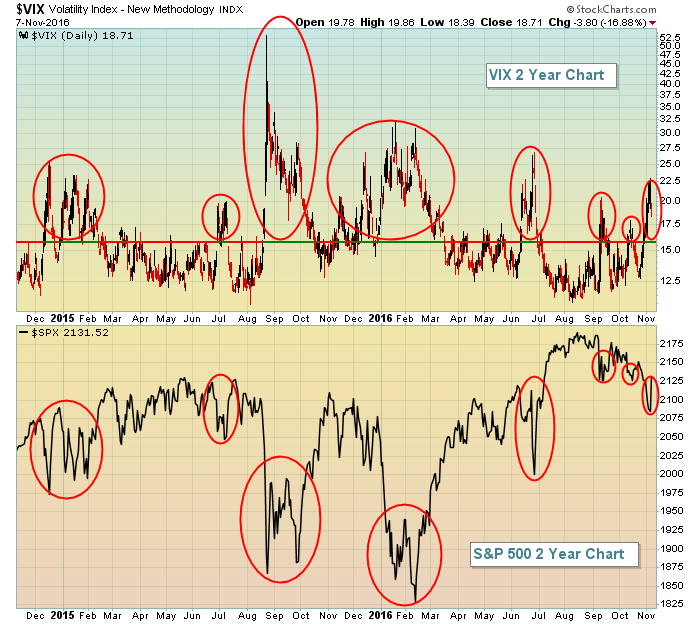 The problem for the bears is that just after the VIX soars, the market normalizes again and the VIX returns back to low levels so the weakness fades and complacency returns - the perfect ingredient for a resumption of the bull market. Once again, if you go back to the bear markets of 2000-2002 and 2007-2009, the VIX never falls below 16 so expected volatility remains high.
My best analogy for a bear market is it's a lot like a tornado. The right conditions need to be present for a bear market or a tornado to develop. One necessary component of a bear market is the expectation of a storm brewing. The VIX provides us that clue so keep a close eye on it in coming days and weeks.
Sector/Industry Watch
The financial sector (XLF) has been very strong over the past four months as treasury yields have been rising. That strength was quite clear on Monday as the group broke out - again. Interest-sensitive groups like life insurance ($DJUSIL) and banks ($DJUSBK) continue to perform exceptionally well and the chart below shows the breakout and relative leadership that the XLF currently enjoys:
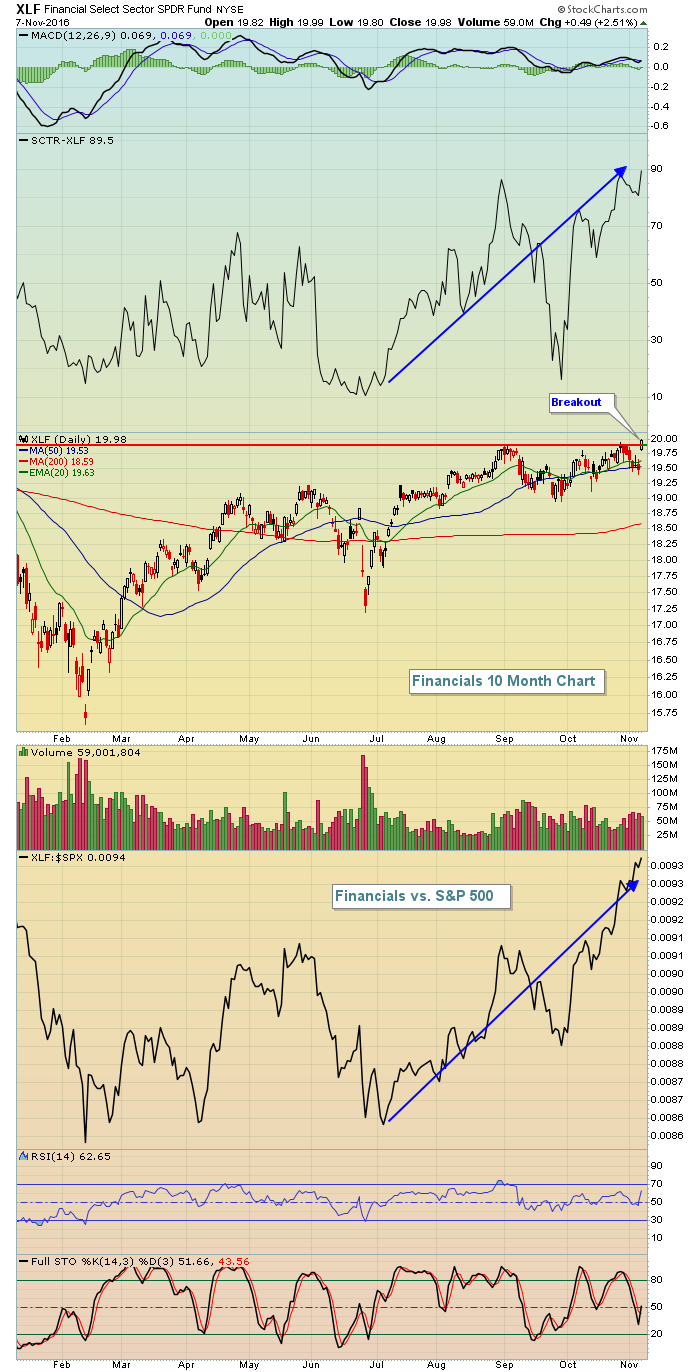 The strength is obvious from the breakout on Monday, but it's also quite apparent when you see that the XLF has the highest SCTR ranking among sectors now - it's surpassed technology (XLK) - and it's relative strength vs. the benchmark S&P 500 is soaring as well. You want to ride relative strength and that suggests you remain on board the financial sector, at least while treasury yields remain in an uptrend.
Historical Tendencies
Historically, the S&P 500 is in a lull right now. November 7th to November 18th has produced little for the bulls as the annualized return for this period has been +2.43% over the last 66 years. We then typically have a few rough days from the 19th through the 22nd before the bullish Thanksgiving holiday season kicks in. I'll provide more about the latter part of November in another week or so.
Key Earnings Reports
(actual vs. estimate):
CVS: 1.64 vs 1.57
DHI: .75 vs 77
JCI: 1.21 vs 1.14
VRX: 1.55 vs 1.78
WLK: .86 vs .90
(reports after close, estimate provided):
CXO: .20
TRIP: .42
Key Economic Reports
None
Happy trading!
Tom
