Market Recap for Friday, December 9, 2016
Gains permeated our major indices on Friday, but it was difficult to overlook the flight to safety. Perhaps traders were just growing a bit more cautious after the huge run higher the past month or maybe it was big money knowing that the next week tends to be bearish historically. Whatever it was, conditions changed at least for a day. First, the Russell 2000 lagged the other major indices by a wide margin as that small cap index barely posted a gain while the Dow Jones was jumping 142 points and climbing closer and closer to that psychological 20000 level. Next, sector rotation was very weak with leadership on Friday coming from consumer staples (XLP, +1.44%), healthcare (XLV, +1.22%) and utilities (XLU, +1.05%). Bull markets thrive on wide participation, though, as we want to see all sectors remain technically sound and on buy signals.
The XLP recently printed a positive divergence and that slowing downside momentum has turned in a big way with the sector clearing its 50 day SMA Friday. Take a look:
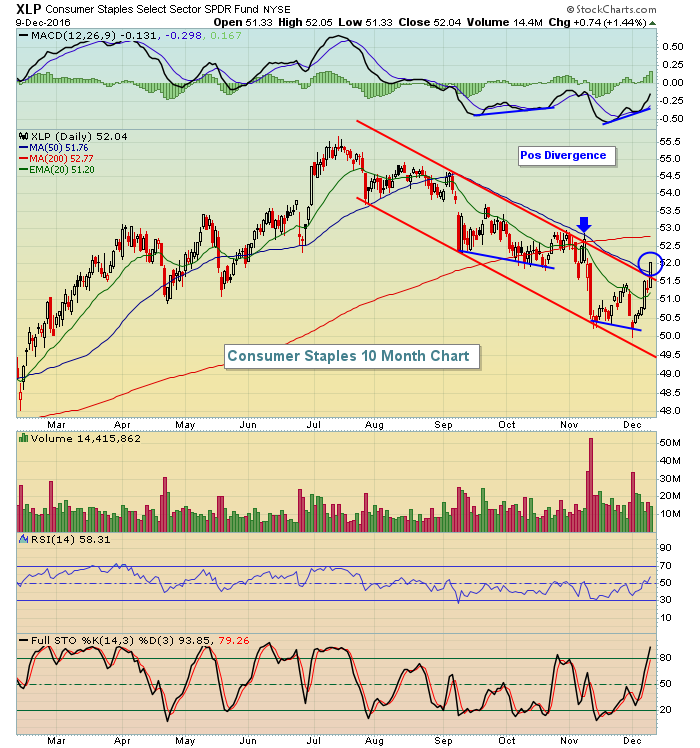 The surge on Friday in consumer staples stocks cleared 50 day SMA resistance, which is technically significant in my view given the positive divergence that preceded this move. I'd now look to the rising 20 day EMA as excellent support on future selling. Note that the last positive divergence resulted in a test of 50 day SMA resistance, but failure (blue arrow). This time the group has not only cleared its 50 day SMA, but it's also broken its down channel.
Strength in healthcare Friday was primarily the result of pharmaceuticals bouncing at a major long-term price support level. Buying in this industry group occurred just in time as you can see from the following chart:
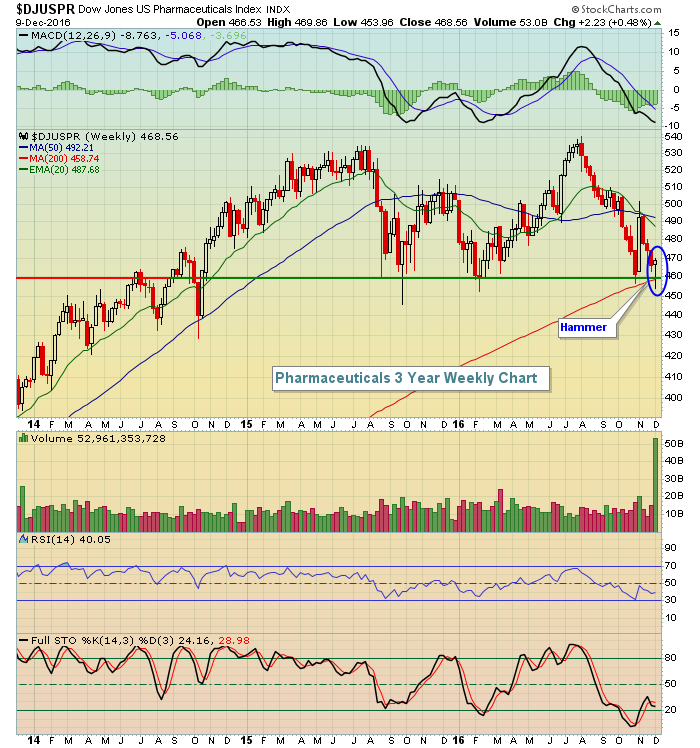 The hammer would suggest a reversal of the recent downtrend and price support provides limited risk.
Pre-Market Action
There are no economic reports this morning, but it's anything but quiet. Overnight, we saw both China's Shanghai Composite ($SSEC) and Hong Kong's Hang Seng Index ($HSI) tumble more than 2% as the Chinese government instituted new regulatory curbs on "barbaric" stock acquisitions by insurers. That was a negative, but crude oil ($WTIC) is soaring more than 4% in early action after non-OPEC members agreed to join OPEC members in cutting production. This is very significant technically as key bullish patterns on crude are likely to be confirmed today. In my view, this now sets a short-term target on crude at $65 per barrel and a longer-term target at $75-$80 per barrel. Check out the Sector/Industry Watch section below for a refresher on crude.
Treasuries are being sold ahead of this week's FOMC meeting with the 10 year treasury yield ($TNX) at 2.50% once again, challenging a key overhead yield resistance level. I believe a close over 2.50% increases the odds of a further push to 3.00%, a level not seen since the end of 2013. That would likely provide more tail winds for financial stocks.
Dow Jones futures are up slightly, suggesting a flat open. NASDAQ futures, however, are considerably weaker as technology may open a new trading week under selling pressure.
Current Outlook
We've seen solid leadership in 2016 from both the energy and financial sectors and I look for that to continue in what could be the last major bull market push. Many times energy and financials lead during the end of an economic cycle and both these groups appear poised to lead for the foreseeable future. I expect this rally to be very strong. The catalysts for strength in the XLE and XLF are fairly obvious now. Energy should benefit from the rising crude oil prices, including its major breakout today. Financials have been soaring on a rising interest rate environment and I believe the Fed will let us know this week that our economy is strengthening and we'll likely see further small increases in the fed funds rate in 2017.
Here's the relative performance vs. the benchmark S&P 500 for both the XLE and XLF in 2016:
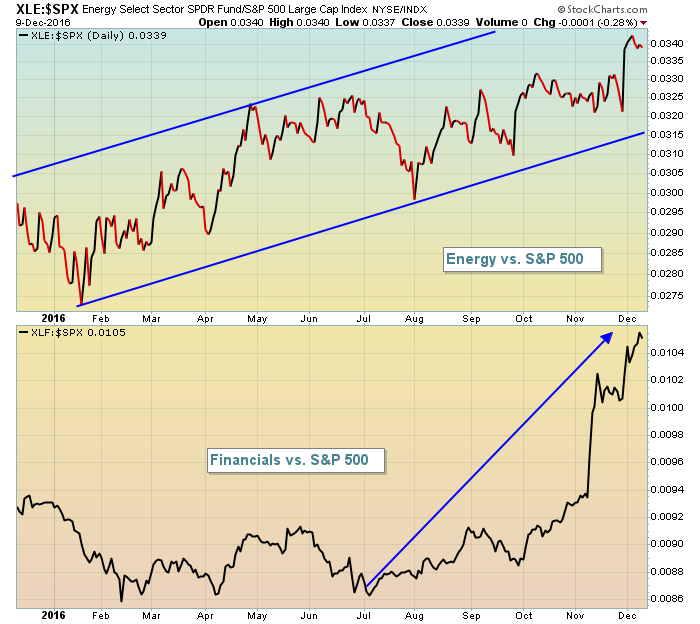 Energy's relative strength has been even throughout 2016, steadily rising. Financials, on the other hand, saw a very specific and sudden relative burst when the 10 year treasury yield ($TNX) bottomed and began surging higher. I expect to see continuing relative strength from both sectors, although short-term relative pullbacks should be expected from time to time.
Sector/Industry Watch
Here's a refresher on the long-term reverse head & shoulders pattern in play on crude oil ($WTIC):
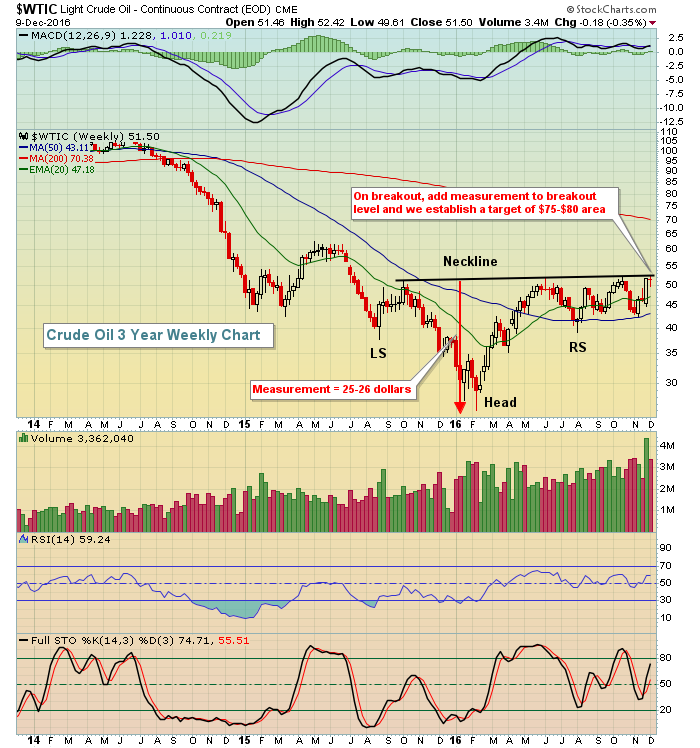 This morning's surge in crude oil prices will likely confirm this bullish reversing pattern and a potential measurement to $75-$80 per barrel. That would be a catalyst for higher energy shares for sure.
Monday Setups
Last week, I provided a few setups during my Trading Places LIVE webinar. They included the following:
CBI:
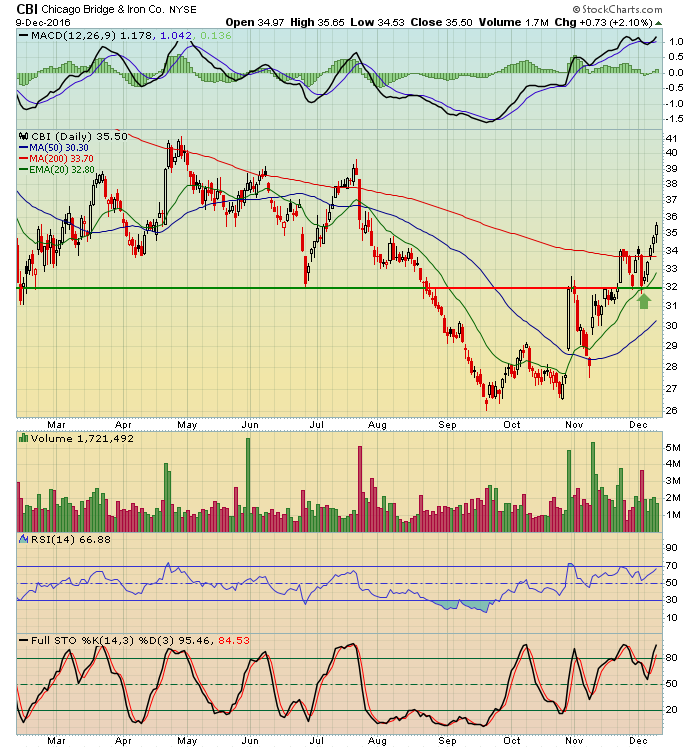 The timing here was perfect as CBI's uptrend was established and the pullback to its rising 20 day EMA (green arrow) provided a solid reward to risk entry that resulted in a 10% move higher by week's end.
I'll be discussing all of the setups from last week and possible trades for this week during my Trading Places LIVE webinar that begins today at 1pm EST. You can REGISTER HERE. Hopefully I'll see you there!
Historical Tendencies
Profit taking typically takes place December 11th through December 15th and the stock market has historically performed poorly on Mondays. So today could set the table for performance this week.
Key Earnings Reports
None
Key Economic Reports
None, but the FOMC meeting starts Tuesday with the announcement due out on Wednesday at 2:00pm EST
Happy trading!
Tom
