Market Recap for Thursday, December 8, 2016
The Dow Jones Transportation Average ($TRAN) finished higher once again on Thursday and has now risen more than 4% this week. In addition, the TRAN has climbed 16.7% since the close on November 4th. It's been an amazing run for a group of mostly slow movers that had been locked in a fairly narrow 10% range for much of 2016. If you want to visualize how much the psyche of traders has changed in the last month, look no further than this chart of the TRAN:
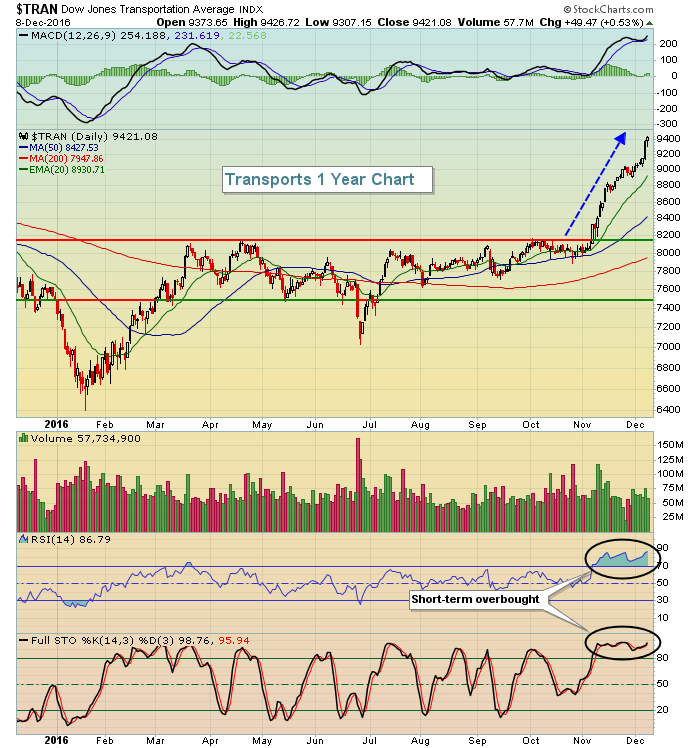 That's an impressive rally. The only real issue technically is that the TRAN is very overbought and its MACD is very stretched. It could use a bit of profit taking to relieve these overbought conditions, but the question becomes when? The TRAN became overbought a month ago. During bull market rallies, overbought can remain overbought for quite some time and these past few weeks are proof.
Financials (XLF, +0.94%) led Thursday's rally and we've seen remarkable relative strength from the XLF over the past month - just like we have seen in the transports. These have been two dominant themes of this latest bull market rally. The chart of the XLF looks quite similar to the transports. Have a look:
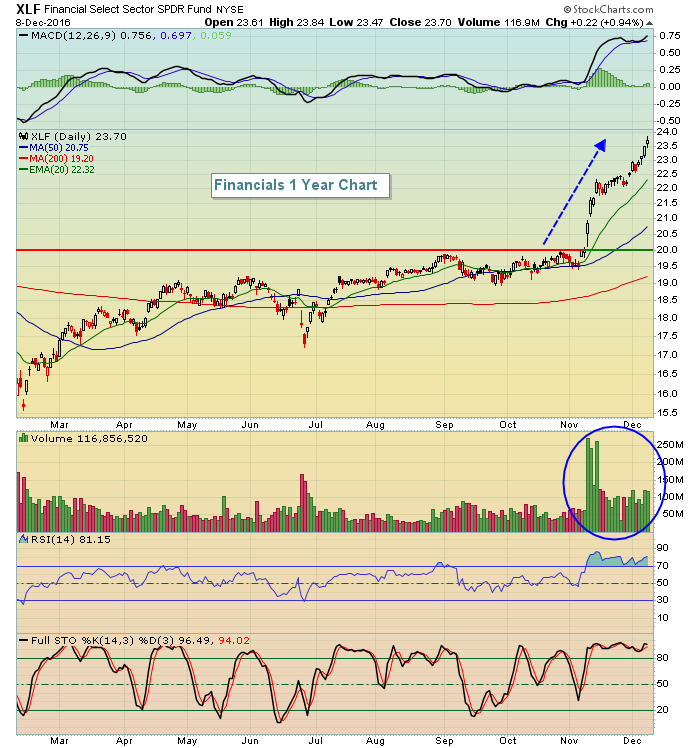 There's one thing in technical analysis that's very difficult to overlook - significant directional moves on extremely heavy volume. Look at the above rise in financial stocks over the past month and check out the massive increase in volume to accompany it. That's accumulation personified. That's not something to ignore. Huge bets are being made on financial stocks and the quick rise in treasury yields has certainly provided a catalyst for the group.
Consumer discretionary (XLY, +0.00%) was flat on Thursday, but that didn't stop home construction stocks ($DJUSHB) from posting solid 2.13% gains, resulting in many breakouts among component stocks. I review the industry and a few stocks below in the Sector/Industry Watch section below.
Pre-Market Action
Global markets are mostly higher as key indices in Asia finished higher, including Tokyo's Nikkei ($NIKK), which rallied 1.23% overnight. Europe's gains are slight, but most indices are fractionally higher as we end a very bullish week for global equities.
Crude oil ($WTIC) is up 1% this morning as it inches closer and closer to a major break of resistance near the $52 per barrel line.
Treasuries are slightly lower with the 10 year treasury yield ($TNX) up a couple basis points to 2.41% in early trade.
Dow Jones futures look to continue the recent U.S. equity rally as they're up 28 points 30 minutes prior to the opening bell.
Current Outlook
Energy (XLE) has performed exceptionally well of late and throughout much of 2016, but I believe the best is yet to come. I'm still awaiting a breakout in crude oil ($WTIC) and I think it'll happen sooner rather than later. When it does happen, I expect to see a very strong advance in the price of crude and that generally coincides with a strong energy sector. Here's a look at the WTIC on a shorter-term daily chart:
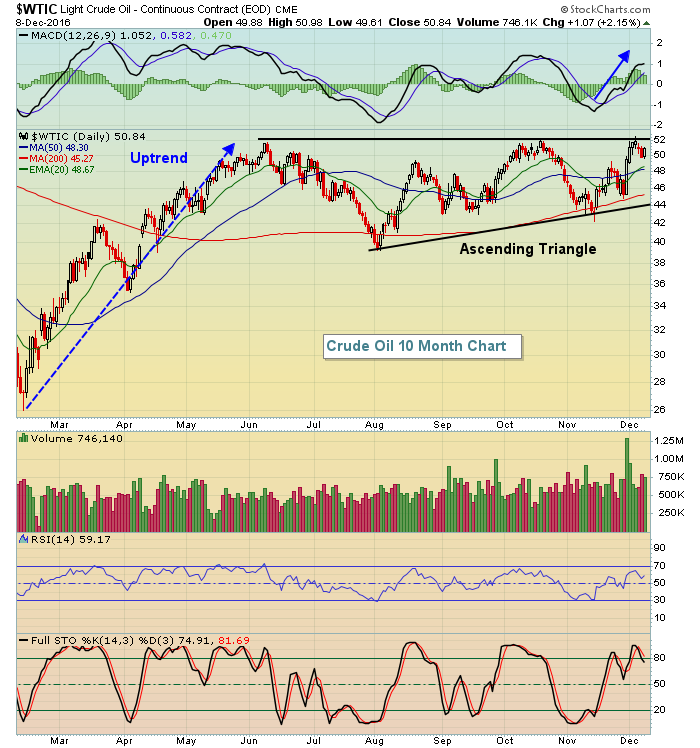 I've discussed crude oil quite a bit lately, but that is one beautiful ascending triangle. And given all the other bullish signs that have developed, I believe it's just a matter of time before crude oil follows global markets higher. In addition to the obvious positive implications it should have on the XLE, don't overlook the impact it could have on renewable energy ($DWCREE) in the weeks and months ahead. The DWCREE is up more than 12% since its low of 50.71 on December 1st and this rally may just be beginning. A solid close above its 50 day SMA would be the next resistance level to clear while it will be important for the group to hold onto rising 20 day EMA support in the days and weeks ahead.
Sector/Industry Watch
Interest rates are on the rise.....and home construction stocks are breaking out? What gives? Well, there are a few things to consider here. First, I've highlighted the historical performance of home construction stocks below in the Historical Tendencies section. Second, while treasury yields are on the rise, they are rising from historic lows. Interest rates are still extremely low, making housing very affordable. The market is suggesting that the anticipated economic strength will have a far greater impact on housing than a rising rate environment will have a negative one. Time will tell. In the meantime, the technicals do not lie and they are strengthening with regard to homebuilders. Check out this chart:
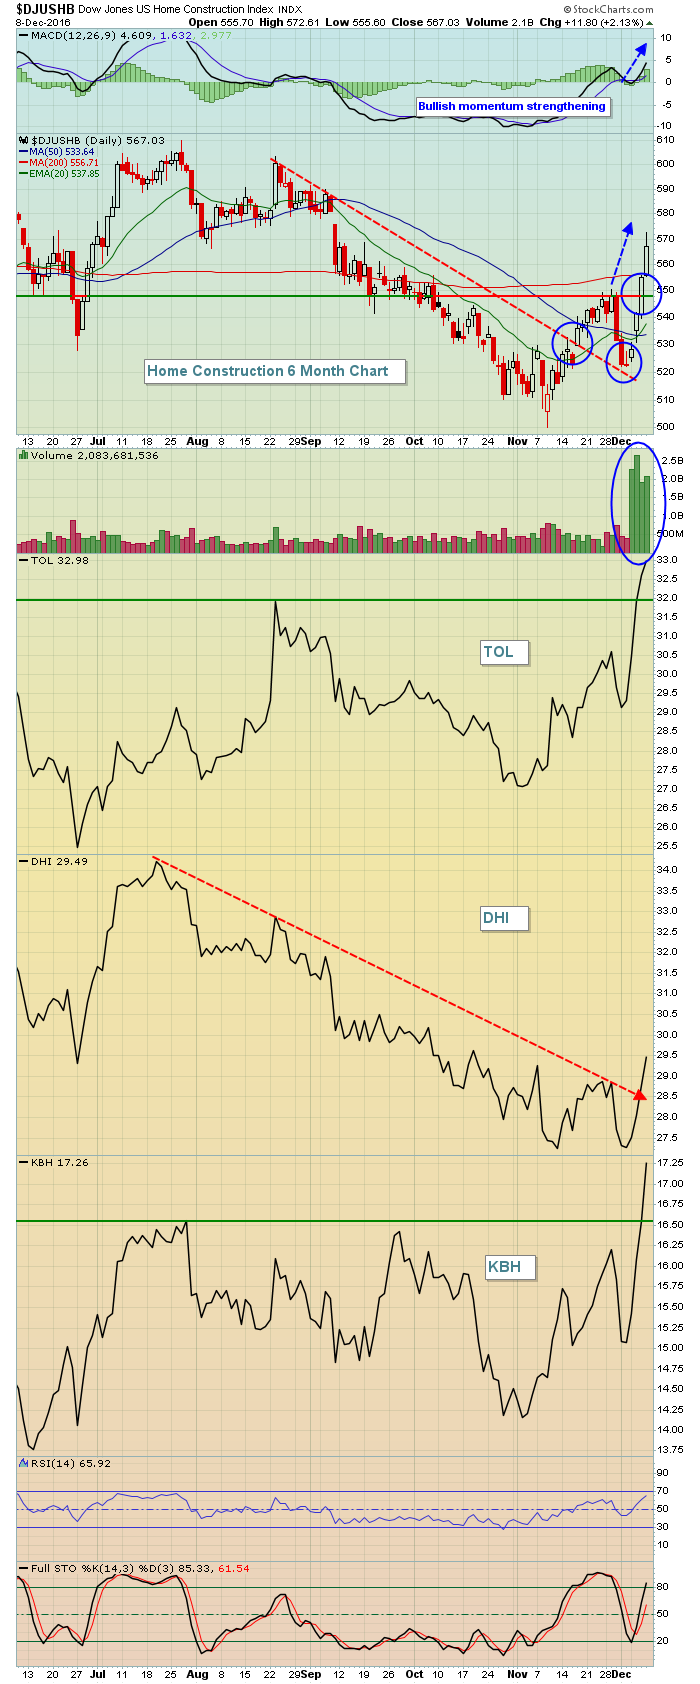 On the price chart of the DJUSHB, there are three blue circles, the first of which marks the break of the downtrend. The second blue circle shows a back test of the trendline, then the third highlights the next price breakout. Momentum is now strong, volume trends confirm and I've listed three homebuilders that have either just broken out to new highs (TOL, KBH) or have broken a downtrend line (DHI). This group looks strong and, outside of a temporary pullback to relieve overbought conditions, I'd expect higher prices ahead.
Historical Tendencies
Tis the season....for homebuilders. It doesn't make a whole lot of sense because you might expect to see this group perform well as weather improves on the east coast into April and May. By then, however, the gains have been made and you're stuck wondering why the group is selling off as fundamentals improve. It's just the way the stock market works. The stock market looks ahead and right now it likes what it's seeing from home construction stocks.
The strength in homebuilders since the second week of November isn't a big surprise to historians. Check out the seasonal performance of this group over the past 17 years:
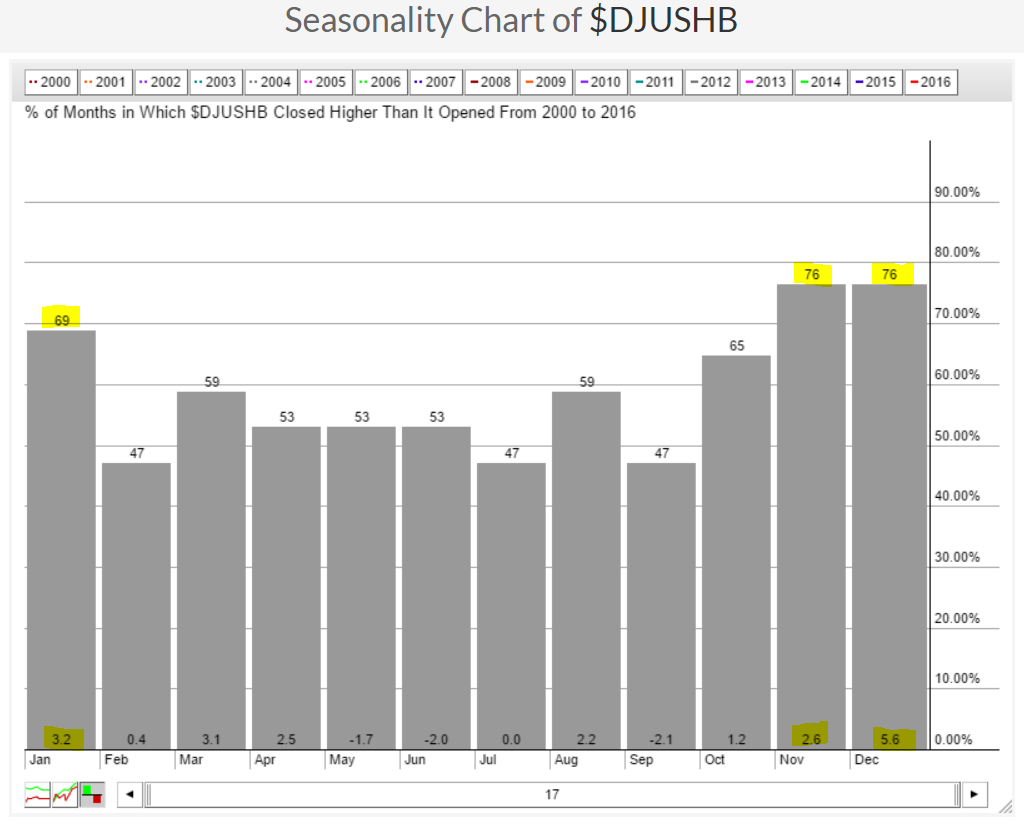 The gains from November through January are by far the best we see throughout the calendar year. We're in their historical sweet spot right now and many stocks in the group look very solid technically heading into year end.
Key Earnings Reports
None
Key Economic Reports
December consumer sentiment to be released at 10:00am EST: 94.1 (estimate)
October wholesale trade to be released at 10:00am EST: -0.4% (estimate)
Happy trading!
Tom


