Market Recap for Wednesday, December 21, 2016
Energy (XLE, +0.16%) was one of just two sectors that headed higher on Wednesday with materials (XLB, +0.4%) being the only other. That wasn't enough to carry the market higher as our major indices all finished fractionally lower on the session. Despite the overall strength in energy, renewable energy ($DWCREE) had a rough day, falling 3.40% as it was easily the worst performing industry group.
While action was fairly quiet, gambling stocks ($DJUSCA) was a notable industry group leader and it was timely as you can see from the following weekly chart:
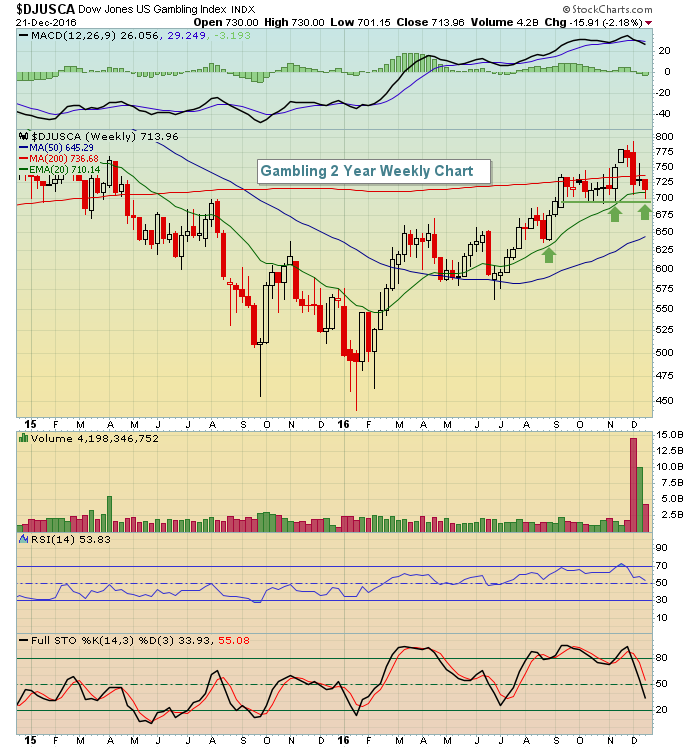 Recent price support (green horizontal line) has been holding near 695-700 and the rising 20 week EMA has been providing excellent support (green arrows) during consolidation and periods of profit taking. If holding gambling stocks, you want to see these two levels continue to hold off the bears.
Pre-Market Action
Gold ($GOLD) is continuing its downward spiral this morning as this metal has seen almost zero strength the past seven weeks. It's perhaps the only area of the market that I'd consider shorting. Fundamentals (rising dollar) and technicals (weak momentum) will likely lead to more sellers into 2017.
Crude oil ($WTIC) is down slightly and there's very little other key news as volume begins to slow for the holidays.
Dow futures are relatively flat as are most global indices. Asia was mostly flat overnight and Europe is the same this morning.
Current Outlook
As we approach the end of 2016, it's important to note that the relative strength of all of our aggressive sectors is in very bullish patterns. That's noteworthy because that was not the case as the S&P 500 topped in 2000 and 2007, just before each of our last two bear markets. Here's a snapshot of the key sectors vs. the S&P 500 over the past few years:
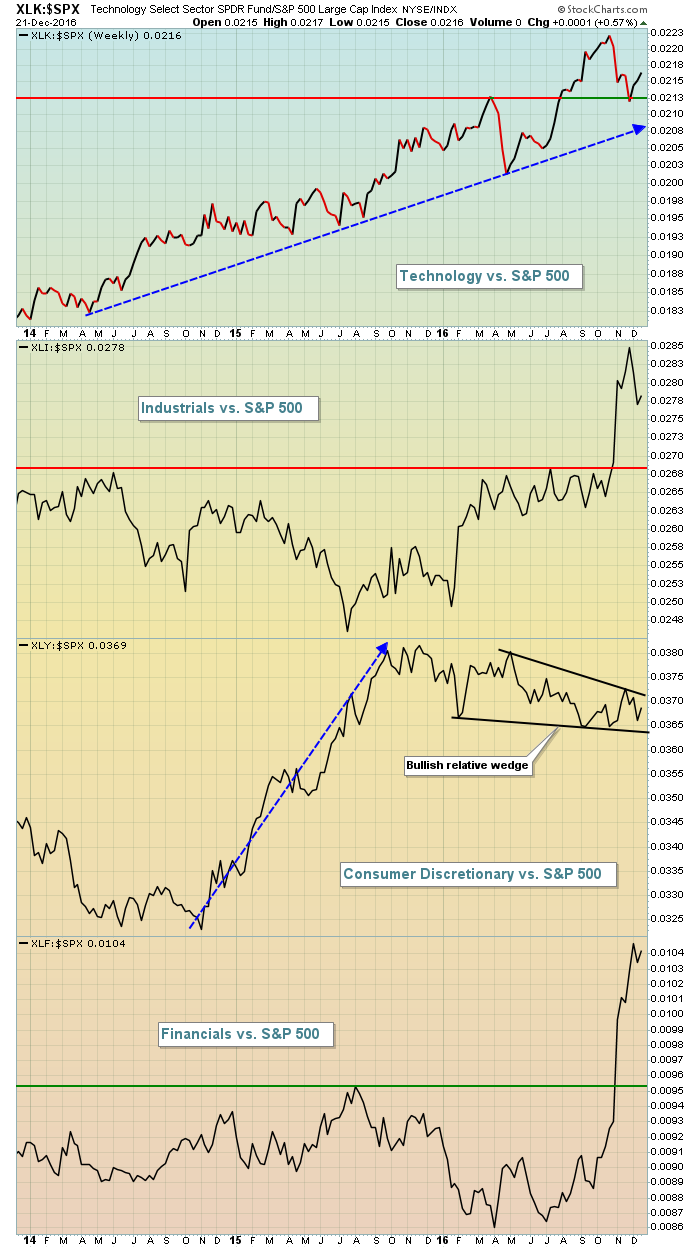 Technology, industrials, consumer discretionary and financials are the four aggressive, or "risk on", sectors. Their relative performance is important because it provides us in a nutshell whether the investing community is willing to take on more or less risk. Bull markets are fueled by the willingness of traders to buy riskier equities. Therefore, based on the above, I believe the U.S. stock market remains quite bullish as we head into 2017.
Sector/Industry Watch
As an add on to what I highlighted above with respect to relative strength of key sectors, I want you to look at how these four sectors were performing on a relative basis vs. the S&P 500 in October 2007 as we topped and headed into a very rough bear market:
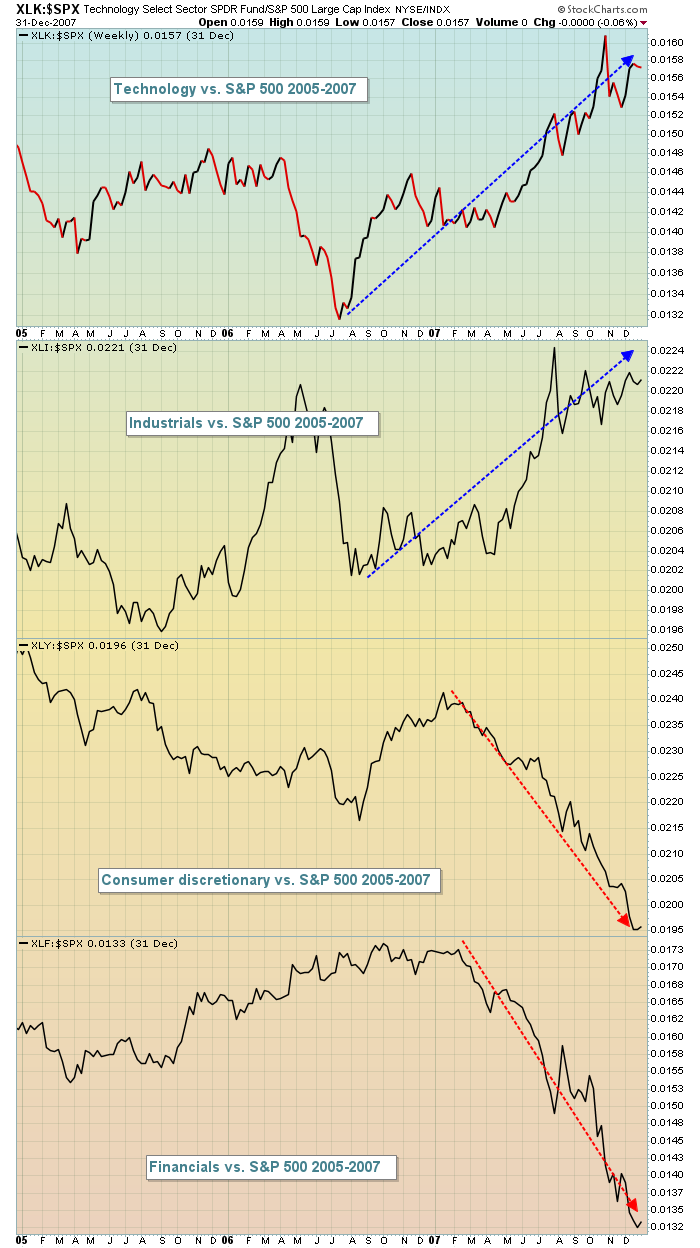 We did not see bullish behavior in October 2007 from all of our aggressive sectors. In fact, as you can see, both financials and consumer discretionary were performing horribly relative to the S&P 500. It's not reflected above, but the defensive sectors - utilities (XLU), consumer staples (XLP) and healthcare (XLV) - all began leading on a relative basis. Also, back in 2007, the Dow transports ($TRAN) lagged the Dow utilities ($UTIL) very badly, which is the complete opposite of what we're seeing now as we head into 2017.
Historical Tendencies
I'm a firm believer that the recent breakout in crude oil ($WTIC) above the $51-$52 level will lead to outperformance in energy (XLE) during 2017. Seasonality also favors energy in the first four months of the calendar year as the following seasonality chart shows:
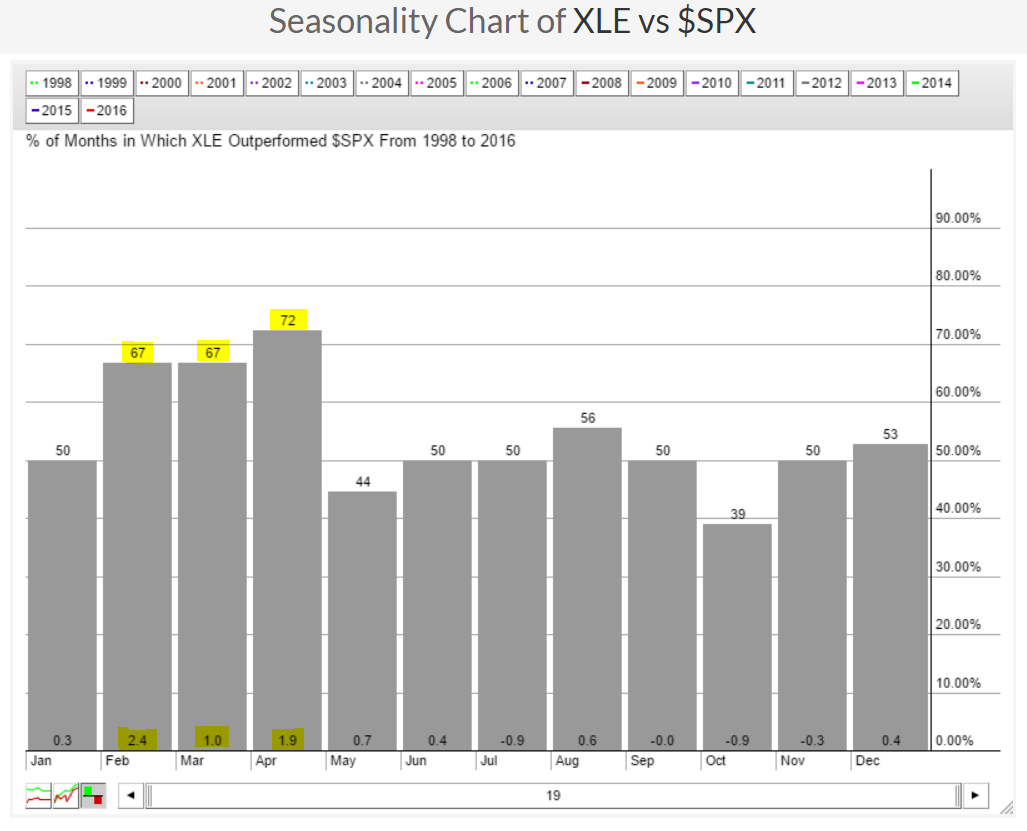 While January is mostly neutral with energy slightly outperforming the S&P 500 by 0.3% on average, check out the relative performance of energy vs. the S&P 500 from February through April. It's clearly the sweet spot for energy over the past 19 years. Using February as an example to explain the above, the highlighted 67 at the top of the bar tells us that the XLE has outperformed the S&P 500 67% of Februarys over the past 19 years. The highlighted 2.4 at the bottom of the bar tells us that the XLE outperforms the S&P 500 by an average of 2.4% over the past 19 Februarys. That's major outperformance. March and April follow up with strong relative performance as well.
Key Earnings Reports
(actual vs. estimate):
CAG: .49 vs .45
RAD: .02 vs .04
(reports after close, estimate provided):
CTAS: 1.16
Key Economic Reports
November durable goods released at 8:30am EST: -4.6% (actual) vs, -4.2% (estimate)
November durable goods ex-transports released at 8:30am EST: +0.5% (actual) vs. +0.2% (estimate)
Q3 GDP released at 8:30am EST: +3.5% (actual) vs. +3.3% (estimate)
Initial jobless claims released at 8:30am EST: 175,000 (actual) vs. 156,000 (estimate)
October FHFA house price index to be released at 9:00am EST: +0.5% (estimate)
November personal income to be released at 10:00am EST: +0.3% (estimate)
November personal spending to be released at 10:00am EST: +0.3% (estimate)
November leading indicators to be released at 10:00am EST: +0.2% (estimate)
Happy trading!
Tom


