Market Recap for Thursday, December 22, 2016
Yesterday's action here in the U.S. had a short-term bearish tone to it, but there were certainly no price breakdowns and no reason to believe it was anything other than a bout of profit taking during a continuing bull market advance. All of our major indices were lower, but volume on the S&P 500 was a holiday-induced below average level. The two key support levels on the S&P 500 are near 2250 (short-term price support) and 2238 (rising 20 day EMA).
Let's turn our attention to a couple key global indices. First, the German DAX ($DAX) that's performed exactly as I expected it would. It broke 10800 resistance and quickly rose to its next level of resistance at 11500, where I suspect we'll see more consolidation. I do eventually see the DAX rising to 12500 to test its all-time high given that the S&P 500 just recently broke out to its all-time high. Here's a visual on the DAX:
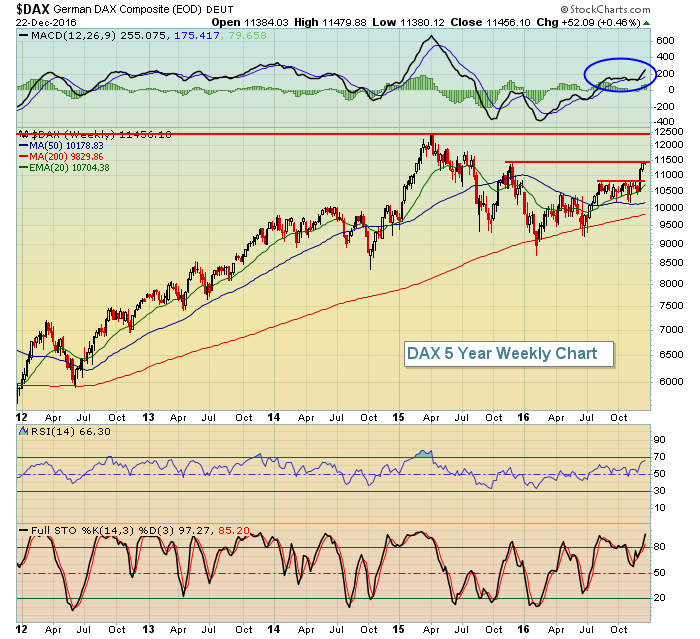 The long-term correlation between the S&P 500 and DAX is very positive so look for the building momentum (MACD pointing straight up - blue circle) in the DAX to continue, although a test of the rising 20 week EMA cannot be ruled out. Still, technical conditions in Germany look quite positive to me.
In Asia, it's a bit different. There's been tremendous bifurcation between the Tokyo Nikkei ($NIKK) and the Hong Kong Hang Seng Index ($HSI). Have a look:
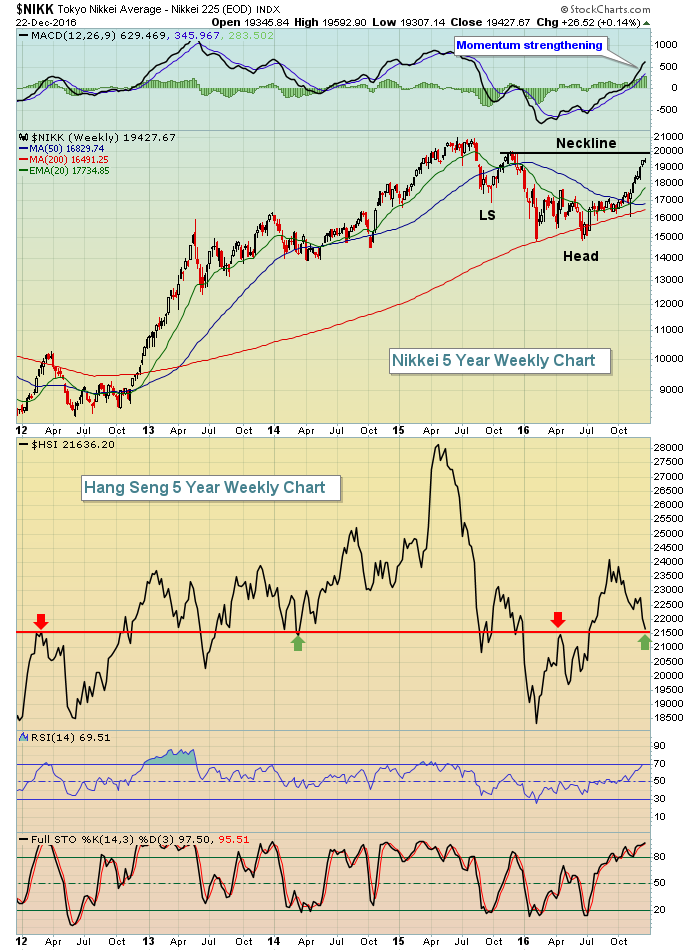 The tale of two markets. While the HSI has been extremely weak, it's nearing a level at 21500 that's been a key pivot level several times over the past few years. The NIKK, on the other hand, has been extremely bullish, but could be approaching 20000 to mark a potential high on the right side of a neckline top. A resulting pullback to test its rising 20 week EMA would be an inverse right shoulder. This pattern, should it develop, is very bullish and bodes well for continued higher prices in Japan.
Pre-Market Action
U.S. futures are lower this morning to complement prices abroad which were mostly lower overnight in Asia and are mixed this morning in Europe. A few buyers in treasuries have emerged this morning with the 10 year treasury yield ($TNX) falling slightly to 2.54%. That will likely result in more consolidation in the financial sector, which could certainly use a bit more consolidation after its extended rally. Crude oil ($WTIC) is down over 1% this morning and that will likely put a lid on energy (XLE) today. Gold ($GOLD) is a tad higher this morning but will end this week on a seven week losing streak as the rising dollar keeps pressure on that metal.
Dow Jones futures are down 17 points 30 minutes from the opening bell.
Current Outlook
The U.S. stock market advance since early November has been a big reminder that overbought conditions can remain overbought during a bull market. While RSI 70 provide topping clues during a consolidation period, that signal is not nearly as critical in a bull market breakout. Look at the Dow Jones chart below:
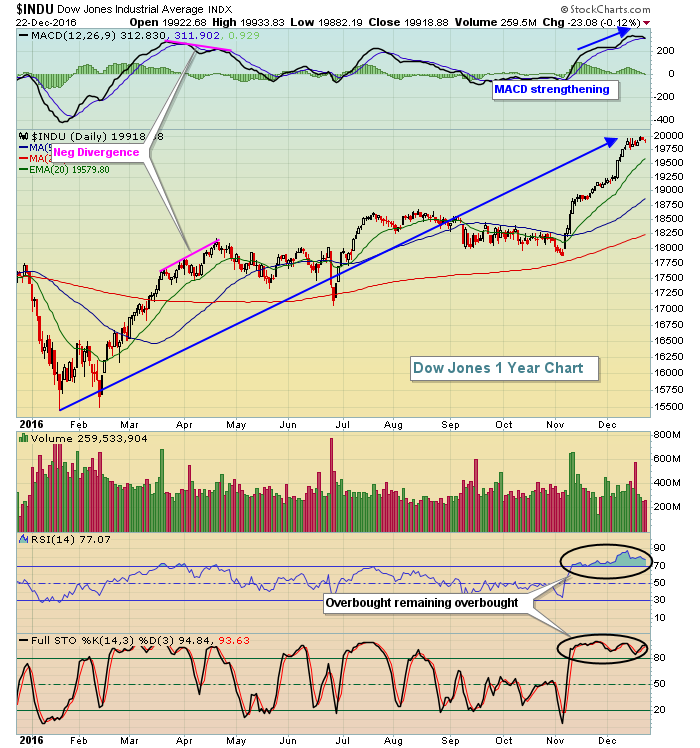 The RSI initially hit overbought territory at 70 back in the second week of November. The majority of the recent move higher occurred after RSI hit 70. So if you decided to sell the Dow Jones at the time it became overbought, you missed almost the entire rally. The key here was that the Dow Jones was in breakout mode and during those periods, it's best to be aware of overbought conditions, but not to make investment or trading decisions based on them.
After the double bottom in February 2015, the Dow Jones embarked on a very similar rally, rising approximately 18% in 3 months - a huge rally by Dow Jones standards. The rally didn't come to its conclusion until we saw signs of slowing momentum in the form of a negative divergence. That's what I'd look for currently and there's no such sign currently. There hasn't even been a 20 day EMA test, which I believe will occur prior to another advance that will likely begin to show momentum issues.
Sector/Industry Watch
If we look back over the past three months stock market performance, it's clear that gold, gold mining and most defensive areas of the market are down and lagging badly. But there are a few components of the aggressive sectors that have not performed well. For instance, of the 16 component industry groups in the industrials sector, there's only one that has a negative return over the past three months - the Dow Jones U.S. Business Support Services Index ($DJUSIV). Take a look at the longer-term weekly chart:
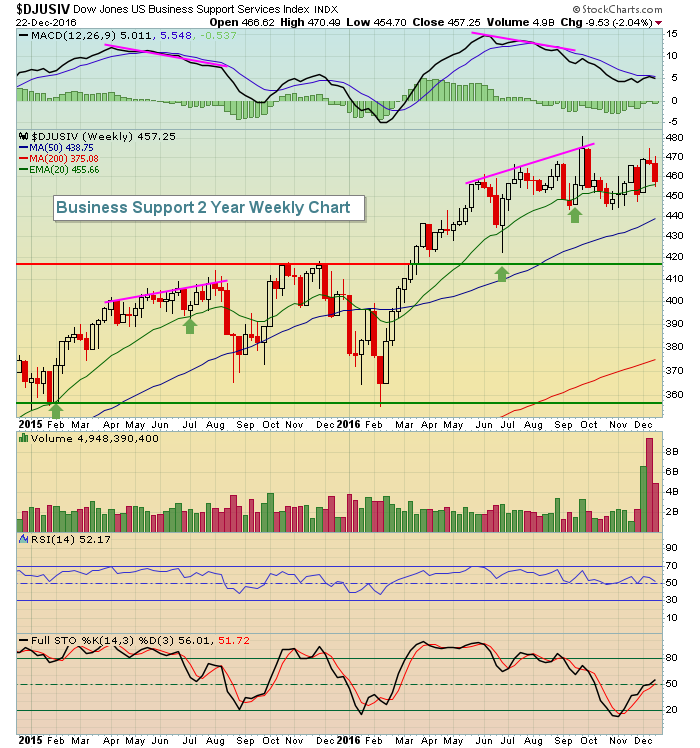 The underperformance of the DJUSIV is quite understandable given the huge prior advance and the slowing momentum and negative divergence. The 2015 advance ended in a negative divergence and history shows us what happened thereafter. These slowing momentum signals, especially on weekly charts, can be powerful. The good news is that I believe the DJUSIV remains bullish. It simply needs to continue unwinding its MACD to at least centerline support, possibly down to the price support level marked above. Then I'd look for another big push in this industry group to the upside.
Historical Tendencies
Next week will be interesting for the Russell 2000 as slight negative divergences on the daily chart will be pitted against extremely bullish historical tendencies. Since 1987, the Russell 2000 has advanced 75 days from December 26th through December 31st, while declining just 45 times. Annualized returns for each day during this period are as follows:
December 26th: +125.49%
December 27th: +21.86%
December 28th: +32.90%
December 29th: +78.88%
December 30th: +97.42%
December 31st: +104.23%
Key Earnings Reports
None
Key Economic Reports
November new home sales to be released at 10:00am EST: 580,000 (estimate)
December consumer sentiment to be released at 10:00am EST: 98.0 (estimate)
Happy trading!
Tom


