Market Recap for Friday, December 23, 2016
The Russell 2000 gained 0.65% on Friday to lead the major U.S. indices. The NASDAQ followed with a 0.28% gain while the S&P 500 and Dow Jones pushed higher, but only by 0.13% and 0.07%, respectively. The Dow Jones continues to flirt with 20000 though it's not yet topped it - even on an intraday basis. 19987.63 remains the all-time high for now. The Russell 2000 has been a strong performer throughout 2016 on both an absolute basis and on a relative basis to the benchmark S&P 500 as highlighted below:
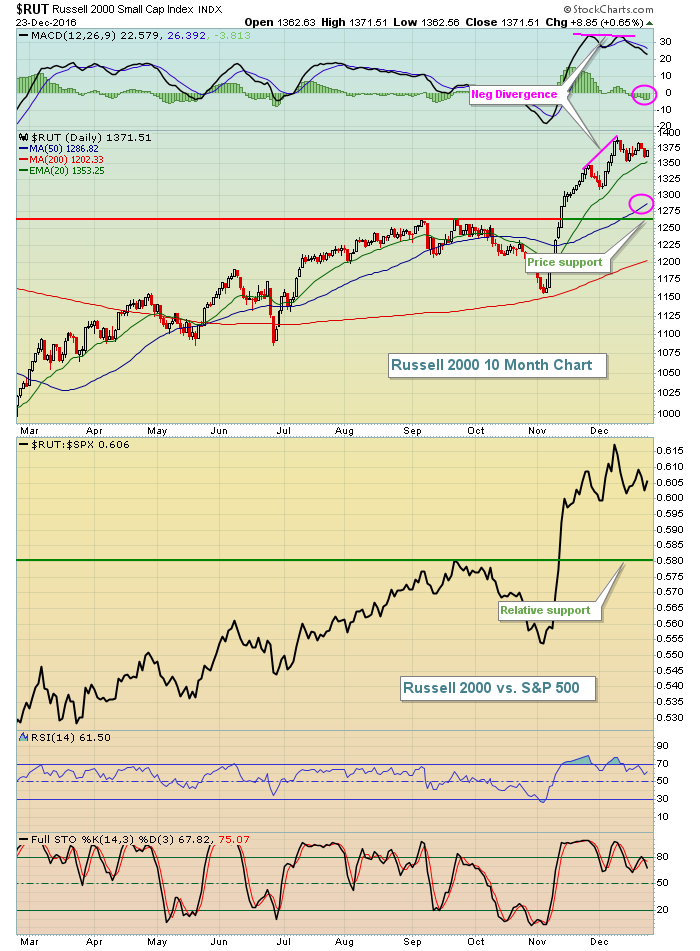 There are a few problems, however, and as a result, I'd look for the S&P 500 to outperform over the next several weeks. First, the Russell 2000 has printed a slight negative divergence and if it sets a new high soon, that negative divergence will be very nasty as momentum has turned down in a significant way the past couple weeks. I wouldn't be surprised to see a MACD centerline test and/or a 50 day SMA test in January or February. We were also very overbought on the Russell 2000 with the RSI touching 80 in November and nearing that level again earlier in December. Finally, check out the Historical Tendencies section below. The Russell 2000 shows significant historical strength in November and December, but history becomes the enemy in January. Slowing momentum and bearish historical tendencies may be too much for the bulls to overcome.
Healthcare (XLV, +0.75%) represented most of the strength Friday and biotechs ($DJUSBT) rose 1.38% to lead the sector. It's also important to note that biotechs are the fifth best performing industry group during the month of January with an average monthly gain of 1.3%. From a weekly chart, it can be argued that the DJUSBT down channel has been broken. A weekly close above 1800 would confirm it and the seasonal strength could be the catalyst for such a move. Here's the weekly DJUSBT chart:
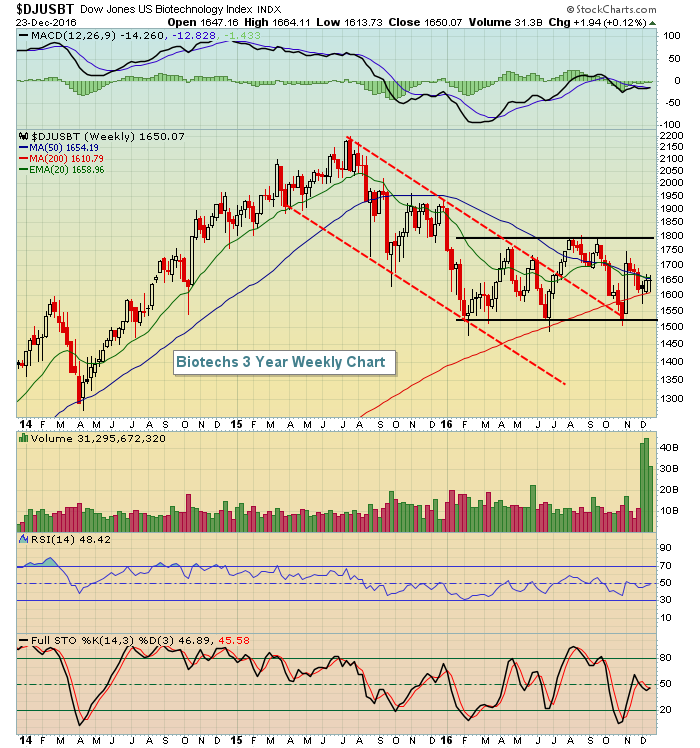 The current trading range on the DJUSBT is 1525-1800. We have not seen a weekly close outside of that range during 2016. But keep in mind we have a prior uptrend in play so I believe the most likely resolution here will be to the upside.
Pre-Market Action
Global markets are quiet with Asian markets mixed overnight and slight gains currently in Europe. That's led to fractional gains in U.S. futures throughout much of the morning. With little in the way of earnings news due out, I'm focusing on the strength of the current rally and the fact that U.S. stocks have a very strong historical tendency to move higher the week between Christmas and New Years.
Current Outlook
The U.S. Dollar Index ($USD) has pushed to new highs near the 103 level, but has done so with a negative divergence suggesting signs of slowing momentum. Any short-term weakness in the dollar could help to stage a short-term rally in gold ($GOLD) as this metal has been trounced over the past 7-8 weeks and it's showing a slight positive divergence. I believe the longer-term downtrend in gold remains intact, however, so any strength is likely to be short-lived. Gold is up about 0.8% in early trading today so perhaps this is the start of a counter trend rally. Just make sure to keep stops in play just below recent lows.
Sector/Industry Watch
The financial sector (XLF) has been the strongest since early November and the Dow Jones U.S. Mortgage REITs Index ($DJUSMR) is currently a strong component industry group. The DJUSMR also happens to be one of the best performing industry groups in the calendar month of January, rising an average of 1.4% over the past nine years. Here's a look at the current technical condition of the group as we wrap up 2016:
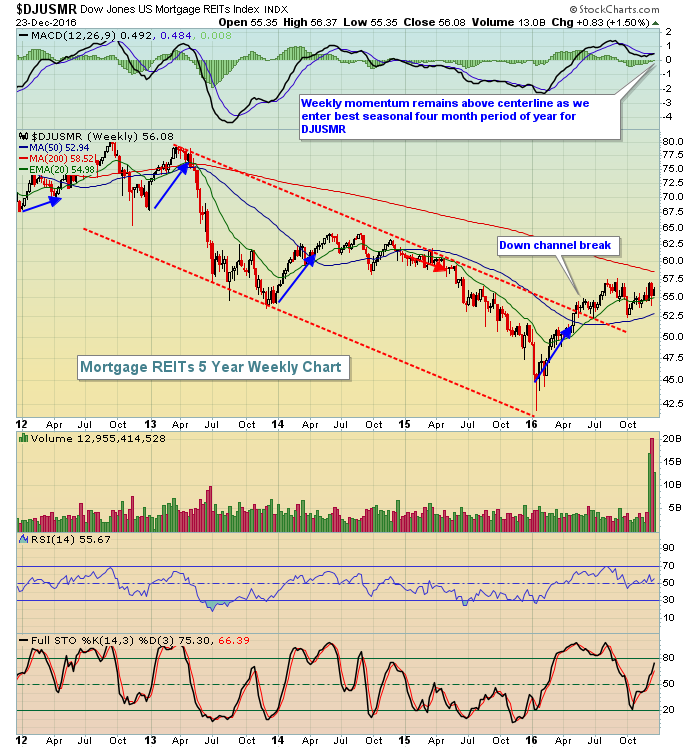 It appears as though the DJUSMR broke its down channel in May and has been uptrending since. Note the four blue lines with arrows pointing higher? This highlights the strength of the DJUSMR during the seasonally strong January to April period. Of the last five years, only 2015 trended lower. Given the technical strength of the DJUSMR and the historical tailwinds upcoming, I'd look for strong performance from this group to open 2017.
Historical Tendencies
I alluded to historical weakness in January for small caps and here's the seasonality chart to back up this theory:
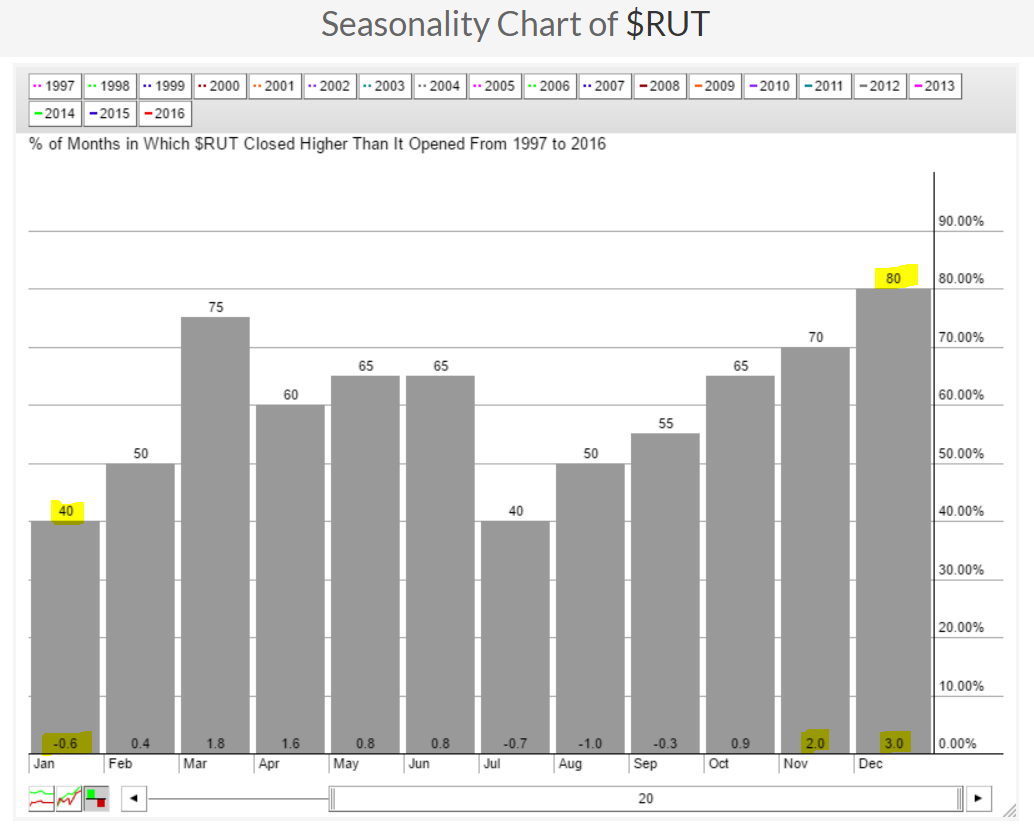 Over the past two decades, December has risen 80% of the time and has averaged gaining 3.0% during this calendar month. January, on the other hand, has risen just 40% of the time and there's been an average January loss of 0.6% over the past 20 years.
Key Earnings Reports
None
Key Economic Reports
October Case Shiller 20-city index to be released at 9:00am EST: +0.5% (estimate)
December consumer confidence to be released at 9:00am EST: 108.5 (estimate)
Happy trading!
Tom


