First, U.S. markets are closed today in observance of the Christmas holiday. Second, my regular Trading Places article which covers the prior days market action, in addition to pre-market action, the current outlook, sector/industry watch, historical tendencies and earnings and economic reports, will be back Tuesday morning as begin a fresh new trading week. Today, I simply want to focus on seasonality and what we might expect as we open up 2017 - based on the past couple decades' performance.
The top performing industry group - and this will likely surprise you - is home construction ($DJUSHB). The DJUSHB has averaged gaining 3.2% in January over the past 17 years and is, by far, the best performing industry group over that span. Right on cue, the DJUSHB bottomed in early November and has been uptrending ever since. Check out the short-term daily chart:
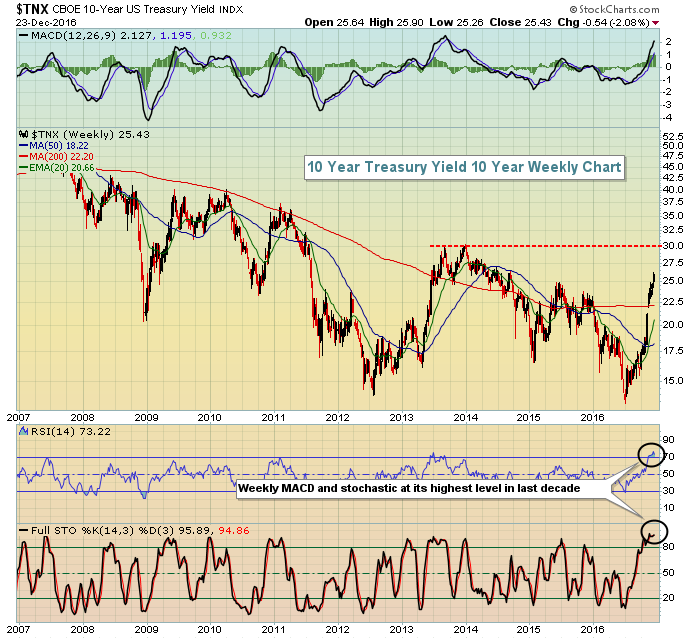
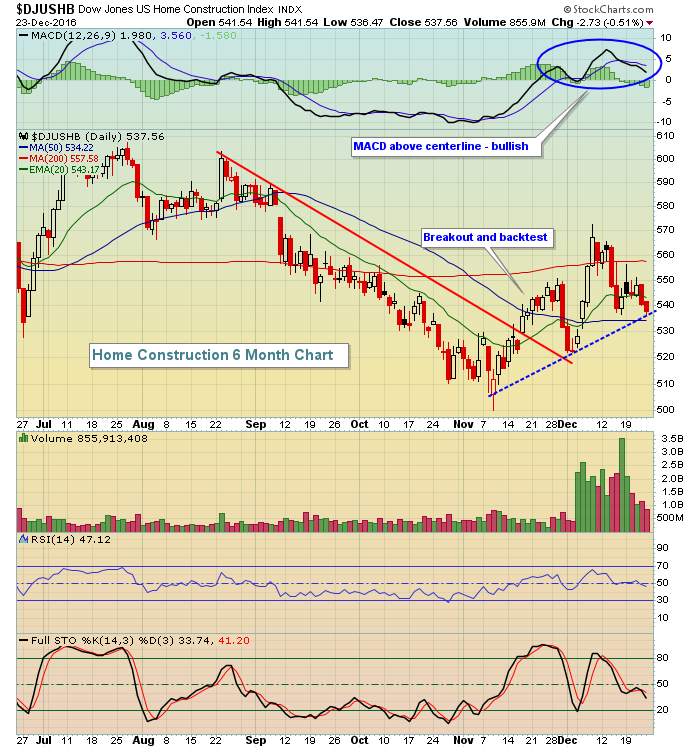 Momentum strengthened almost as soon as November began and the bullish trendline remains intact. The interesting part is that home construction advanced while the 10 year treasury yield ($TNX) had its strongest surge in more than a decade. Here's the TNX weekly chart:
 This might seem counter intuitive as higher interest rates make housing more costly and, therefore, you might expect a surge in rates to cause a decline in home construction stocks. But keep a couple things in mind. First, interest rates, despite the recent rise, are historically very low. Second, if rates are rising due to a strengthening economy, we should see jobs begin to expand, income levels rise and housing actually become more affordable for many. Here at StockCharts.com, you can check out the correlation between two different symbols and the following chart helps to illustrate this:
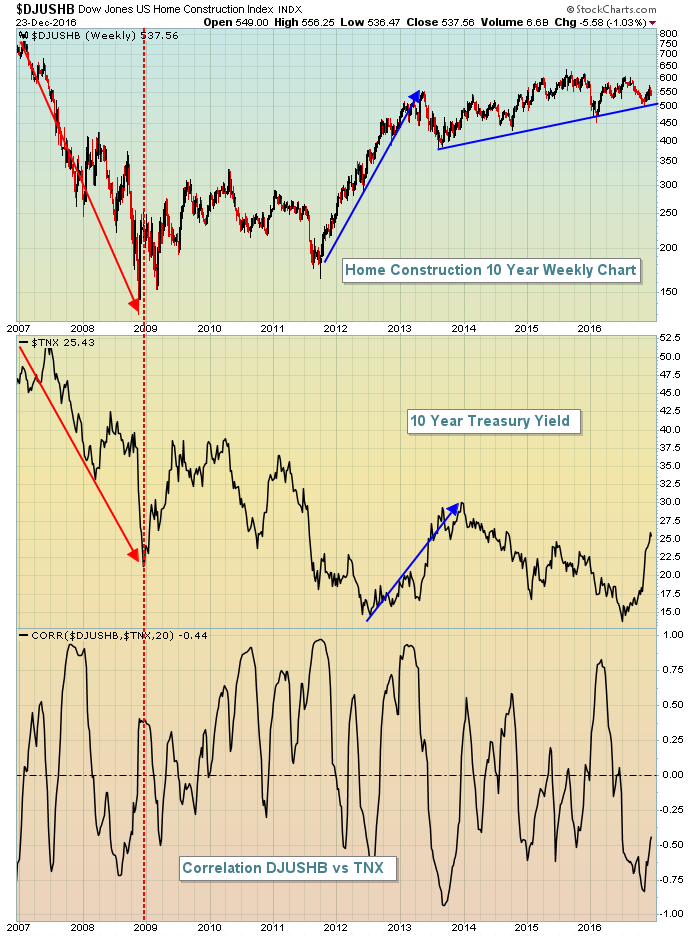 If home construction ($DJUSHB) and the 10 year treasury yield ($TNX) moved opposite one another, the correlation indicator above would reflect values at or near -1. Instead, it appears that the correlation above is positive more often than it's negative. That actually makes sense to me because a strengthening economy should lead to higher home prices and higher interest rates. Likewise, a weakening economy would result in lower demand and lower home prices while interest rates fall to spur economic activity. Check out the rapidly declining TNX during the last bear market. It had little impact in stimulating demand for home prices and the home construction index suffered. Fear was very high at the time and there's little demand for homes under those circumstances. Now, rates are on the rise, but folks feel better about the economy and the industry can weather the rising TNX.
Speaking of weather, isn't it also somewhat shocking that October through April produce the best stock market results for the DJUSHB? That also seems counter intuitive as poor weather in the northeastern U.S. throughout the winter months seems like it should have a detrimental impact on the home construction group. History tells us otherwise.
Here are the other strong industry groups in January based on history (average January returns are provided):
Specialized consumer services ($DJUSCS): +1.8%
Mortgage REITs ($DJUSMR): +1.4%
Oil equipment & services ($DJUSOI): +1.4%
Biotechnology ($DJUSBT): +1.3%
Gold mining ($DJUSPM): +1.3%
Which are a few groups to avoid based on seasonality?
Nonferrous metals ($DJUSNF): -4.5%
Full line insurance ($DJUSIF): -4.4%
Mortgage finance ($DJUSMF): -4.2%
Keep in mind this is just a guide based on history. Much more important are the technical conditions for each group. But if the two line up, the odds of an expected directional move increase greatly in my opinion.
Back tomorrow with my normal Trading Places article!
Happy trading!
Tom


