Market Recap for December 19, 2016
Over the past three months, technology (XLK) has been the 6th best performing industry group, beating out only the three defensive groups - consumer staples (XLP), utilities (XLU) and healthcare (XLV). But the XLK is not in bad shape technically. Instead, we've simply seen the hallmark of bull markets (sector rotation) deal technology a short-term blow. For me, the question isn't whether technology will continue to perform well because I believe it will. The bigger question is whether technology will lead. From the chart below, you can see that momentum is building on the XLK daily chart and we've recently witnessed another price breakout:
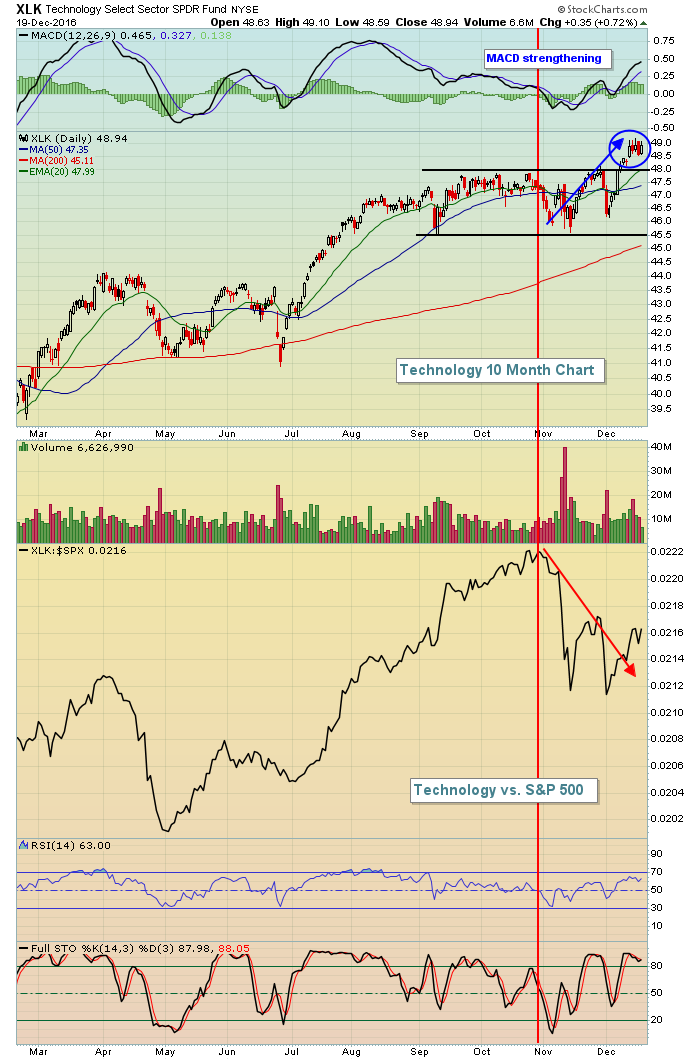 This is what sector rotation looks like in a bull market. Technically, the XLK seems fine in terms of price action with the blue circle representing yet another breakout and the daily MACD pointing straight up. What could be wrong? Well, the problem is that technology made a HUGE relative push higher for the six months from May through October and it's simply stretched and tired on a longer-term basis. Need further proof? Check out the weekly chart on the XLK:
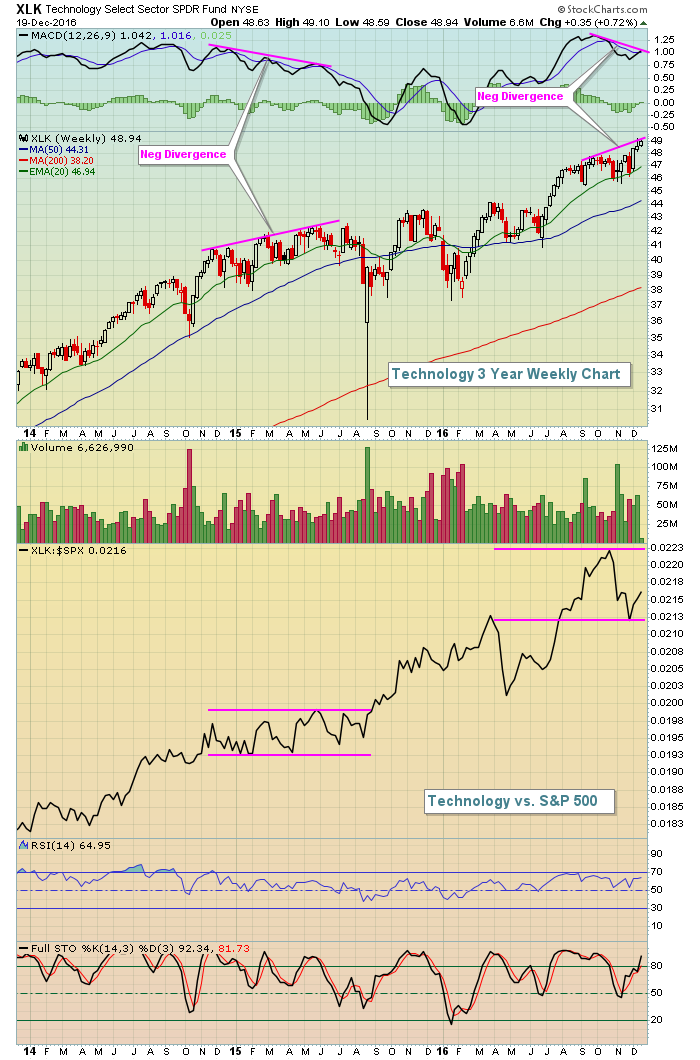 The weekly negative divergence is likely to do what it did back in the first half of 2015 - simply make technology a "performing" group rather than an "outperforming" group. Recently, I've shown negative divergences on the weekly charts of both semiconductors ($DJUSSC) and software ($DJUSSW). That slowing momentum in those two influential technology industry groups will make it difficult for the XLK to be an intermediate-term leader any time soon.
Crude oil ($WTIC) was flat yesterday and that caused the energy sector (XLE) to lag on the day, losing 0.46%. The XLE remains one of the relative leaders, however, and I'd look for the relative weakness to be temporary.
Pre-Market Action
Treasury yields and crude oil are both higher this morning and that's likely to lead to renewed strength in both financial and energy shares today.
Overnight, Asian shares were mixed with the Hang Seng Index ($HSI) down once again and apparently heading for 21500 support. The Tokyo Nikkei ($NIKK) has been absolutely on fire since early November and the NIKK was higher once again last night. The NIKK and HSI are moving in opposite directions.
European shares are mostly higher and that's led to strong U.S. futures. The Dow Jones futures are higher by 48 points with 30 minutes left to the opening bell.
Current Outlook
The NASDAQ 100 has been trailing the S&P 500 over the past several weeks for two primary reasons. First, technology stocks have put their relative breaks on after leading the market for several months. Second, financial stocks (XLF) have been on fire, leading the market by a wide margin over the past three months as that sector has gained more than 21%. The NASDAQ 100 is a non-financial index so it's obviously lagged without representation from that group. Here's the visual of what's been taking place:
 The QQQ tracks the NASDAQ 100 and the SPY tracks the S&P 500. The long opportunity in the QQQ will likely be when the most recent relative downtrend breaks back to the upside. For now, the SPY is the better investment alternative.
Sector/Industry Watch
Industrials (XLI) have been strong during this latest bull market rally, but defense stocks ($DJUSDN) have seen quite a bit of profit taking after their recent breakout. This is a group that could be poised for a rally, along with a couple individual stocks that could lead. Check it out:
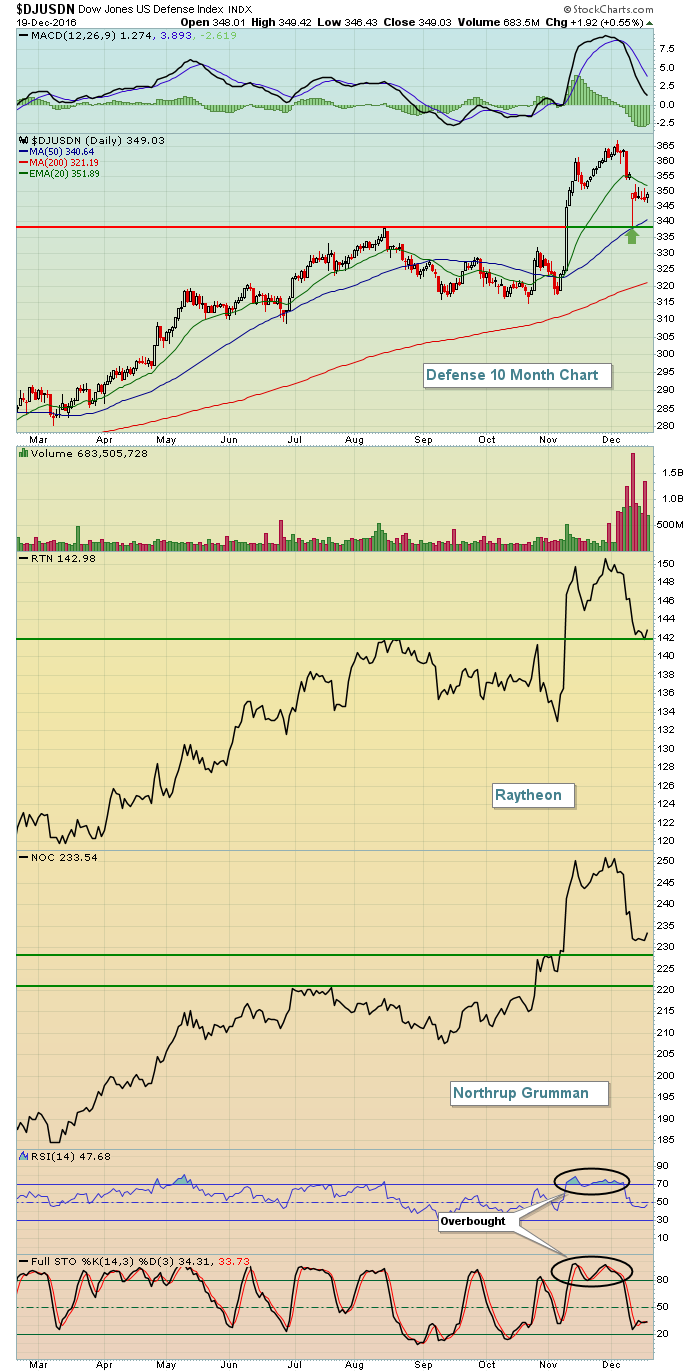 The recent weakness in defense is easily explanable as the DJUSDN had been extremely overbought for a month and simply deserved a rest. But that short-term weakness could be providing a great opportunity in both Raytheon (RTN) and Northrup Grumman (NOC) as they've pulled back to test or near key price support.
Historical Tendencies
I've previously discussed the Russell 2000's annualized return (+77.90%) for the period December 16 through December 31. It's the most bullish period of the year for small caps. Furthermore, when comparing the index value on the December 31st close vs. the December 15th close, the Russell 2000 has moved higher 26 years of 29 since 1987 and small caps are off to a good start this year to make it 27 out of 30. The last time the Russell 2000 moved lower over this period was 2006 so it's currently on a nine year winning streak.
Key Earnings Reports
(actual vs. estimate):
CCL: vs .58 (actual earnings not out yet)
DRI: .64 vs .63
FDS: 1.75 vs 1.70
GIS: .85 vs 88
KMX: .72 vs .71
VAL: 1.37 vs 1.49
(reports after close, estimate provided):
FDX: 2.91
NKE: .43
Key Economic Reports
None
Happy trading!
Tom


