Market Recap for Friday, December 16, 2016
Utilities (XLU, +1.22%) soared on Friday and came very close to a breakout above reverse head & shoulders neckline resistance. This is also very near overhead trendline resistance as well. While we don't want to see the defensive utilities sector lead the market, it is important to see wide participation during a bull market advance. Therefore, a breakout above resistance would be welcomed by the bulls. Here's the chart:
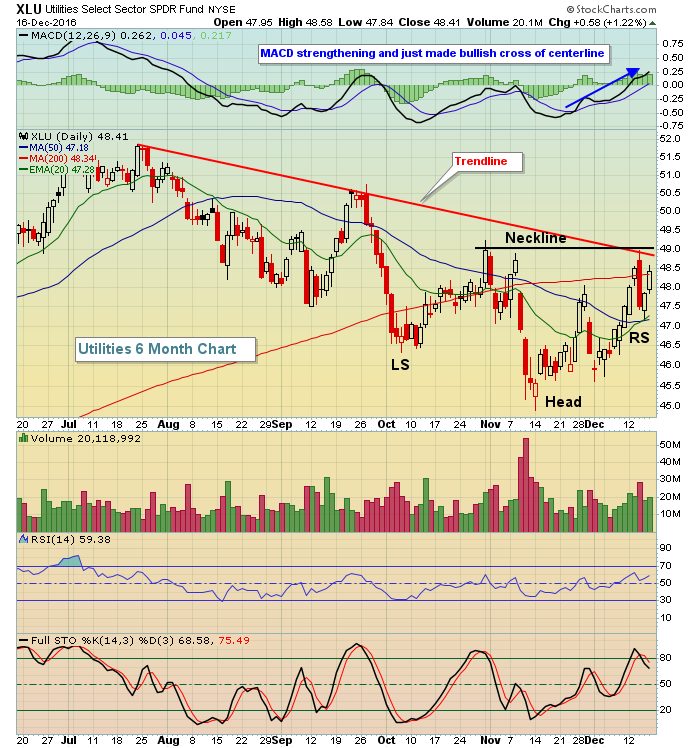 Clearly, a break above 49.00 adds to the strengthening momentum and bullishness so look for that as we close out 2016.
Renewable energy ($DWCREE) jumped more than 6%, leading energy (XLE, +0.62%) to the top half of the sector leaderboard on Friday. The group is strengthening as crude oil ($WTIC) has bounced off its rising 20 day EMA in very bullish fashion. Check out the bullish developments in crude oil in the Sector/Industry Watch section below.
Pre-Market Action
Asian markets overnight were weak and we've seen quite a drop in the Hang Seng Index ($HSI) since it topped back in early September. I believe the index is approaching a significant intermediate-term bottom, however, as the July breakout occurred near 21500. I'd look for a reversal in the 21500-22000 area and then a break above its current down channel at 23000 as confirmation the uptrend is resuming.
European stocks are hovering mostly near their respective flat lines.
As we begin a fresh trading week here in the U.S., Dow futures are pointing to slightly higher prices just 30 minutes from the opening bell.
Current Outlook
The following shows beautifully how the market operates after a 60 minute negative divergence prints:
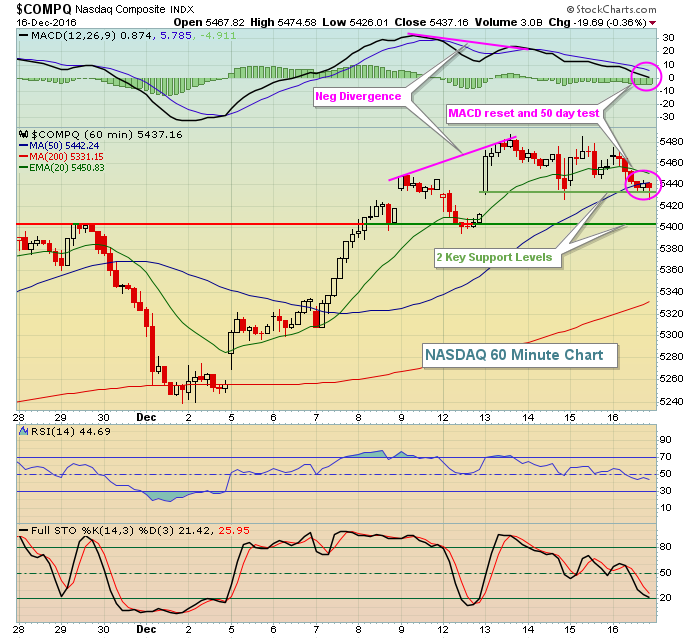 A negative divergence on a short-term 60 minute chart is not doom and gloom for the stock market. It simply means the market's probably gotten a bit ahead of itself in the very near-term and slowing short-term momentum is becoming an issue. It's most valuable for day traders and short-term swing traders because it provides a signal that short-term downside risk is increasing and taking profits on positions is not a bad strategy. Note that within three days after this negative divergence printed, we saw profit taking kick in and a 50 day SMA test and MACD centerline test resulted.
In my opinion, the short-term momentum issues are over. It doesn't mean we'll go straight higher from here, but the odds of a push to the upside are now much higher than they were just 2-3 days ago. The two green support lines above are short-term support. If they fail to hold, then I'd take a look at the intermediate-term daily charts for guidance.
Sector/Industry Watch
I've discussed energy, crude oil and, more specifically, renewable energy stocks several times over the past few months. The breakout in crude oil is particularly bullish because it's cleared major pattern resistance levels. Check out the pullback and bullish bounce off its rising 20 day EMA:
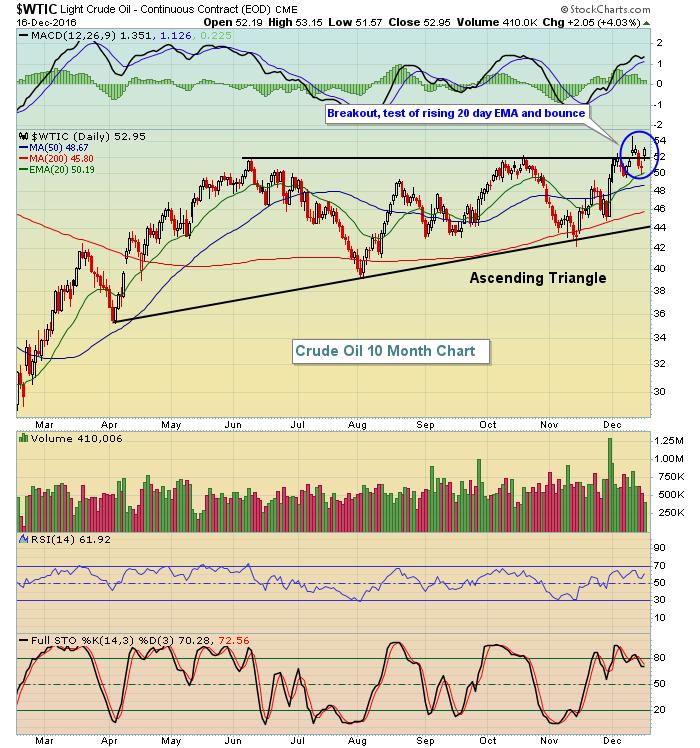 This ascending triangle pattern breakout measures to approximately $65 per barrel and that push higher should continue to benefit energy stocks, particularly renewable energy.
Monday Setups
When trading, one of the keys to success is timing your entry to reduce your downside risk and increase your upside potential. There is no such thing as a guarantee so you must be disciplined to keep your stop in place. By timing entry near key support, you can place stops close to avoid the big losses that destroy a portfolio. Here's an interesting stock that recently beat both revenue and EPS estimates, but has pulled back to a price level where we've seen buyers surface (price support). Check it out:
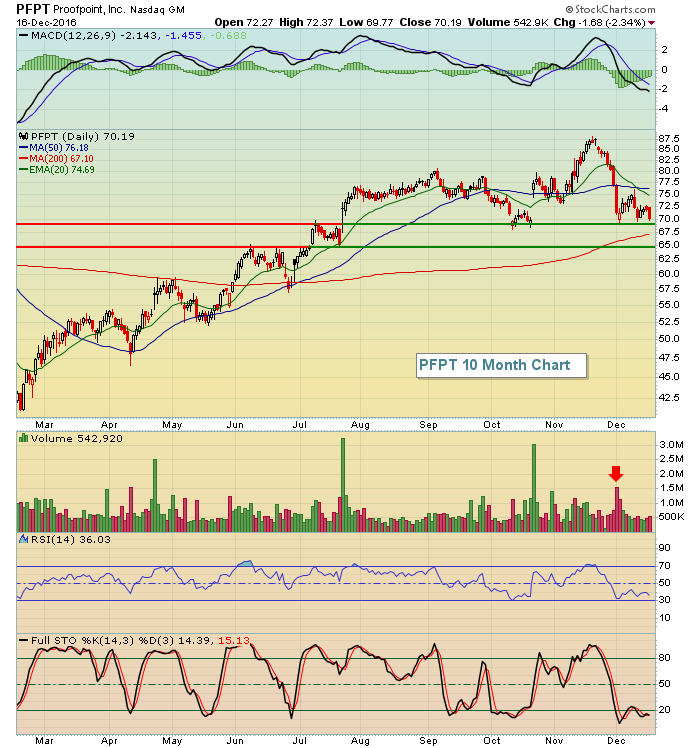 This is a very interesting chart and I'll discuss it in more detail in my Trading Places LIVE webinar that starts at 1pm EST this afternoon. You need a StockCharts.com membership to attend this members-only webinar and now's a great time to join as StockCharts is offering a holiday special. When you subscribe (or renew) for 12 months, you'll receive 2 months free. Or you can subscribe (or renew) for 6 months and receive 1 month free. CLICK HERE to take advantage of this holiday special before it ends!
Historical Tendencies
We're in a very bullish time of the calendar year as the second half of December has significant bullish historical implications. The 19th and 20th, however, are the weak link during this period with annualized returns on the S&P 500 (since 1950) of +3.56% and -24.88%, respectively.
Key Earnings Reports
(actual vs. estimate):
LEN: 1.34 vs 1.27
Key Economic Reports
None
Happy trading!
Tom


