Market Recap for Tuesday, December 13, 2016
Well it's Fed day and both equity and bond markets are prepared for a quarter point rate hike. The big question, however, is whether the market is ready to hear what the Fed has to say about future policy guidance. Will the tone turn more hawkish? If so, look for recent leadership from areas like financials (XLF, +0.26%) to continue. Yesterday, we saw strength return to technology (XLK, +1.26%). A few big names like Apple (AAPL), Facebook (FB) and Alphabet (GOOGL) performed extremely well and that led to relative strength in the NASDAQ, which rose nearly 1% after trading much higher earlier in the session. Surprisingly, the Russell 2000 did not participate, finishing flat for the day. Check out the Historical Tendencies section below, though, and you'll see the huge historical discrepancy in Russell 2000 December performance.
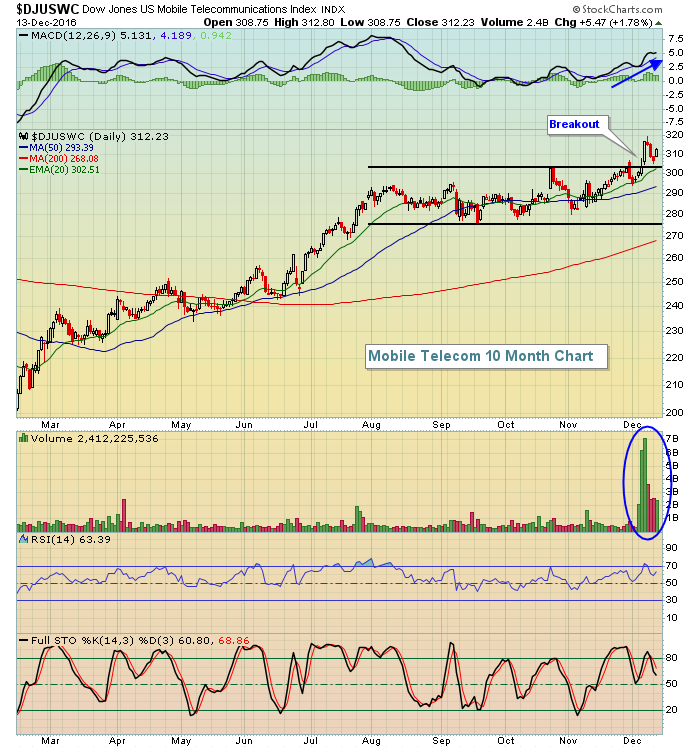
Mobile telecommunications ($DJUSWC) led the technology sector on Wednesday and is in a very bullish formation as highlighted below:
 Momentum is strengthening and volume trends are clearly bullish as the recent breakout was supported by very heavy volume. The bit of profit taking we saw was contained above both price support and its rising 20 day EMA. The DJUSWC appears poised for higher prices.
Pre-Market Action
There are a number of key economic reports out this morning, including retail sales which fell short of expectations. Futures have moved slightly lower with the Dow Jones looking to open perhaps 25 points lower this morning.
Treasuries are higher this morning, with the 10 year treasury yield ($TNX) down 4 basis points ahead of the FOMC announcement.
Current Outlook
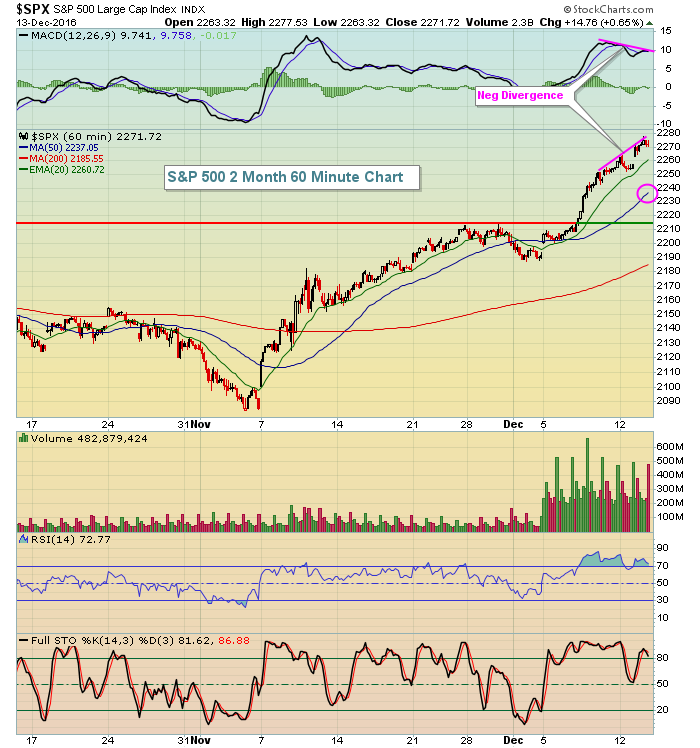
Well, it's Fed day and things can change dramatically from a technical perspective if the market is thrown a curve ball. However, the Fed tries to disclose its future policies in advance as many Fed officials speak often between meetings. So I'm not expecting any huge revelations that shock traders. Still, we'll probably see additional volatility once the Fed announces its policy decision at 2pm EST. Here's a 60 minute chart of the S&P 500 with a couple levels marked that might be worth watching near-term:
 Given the 60 minute negative divergence and overbought conditions, I would not at all be surprised to see a 50 hour SMA test (pink circle), which would represent approximately a 1.5% decline. If that moving average fails, I've highlighted a price support/resistance line near 2215 that could be tested. I'd be surprised if that support level failed to hold during a period of profit taking.
Sector/Industry Watch
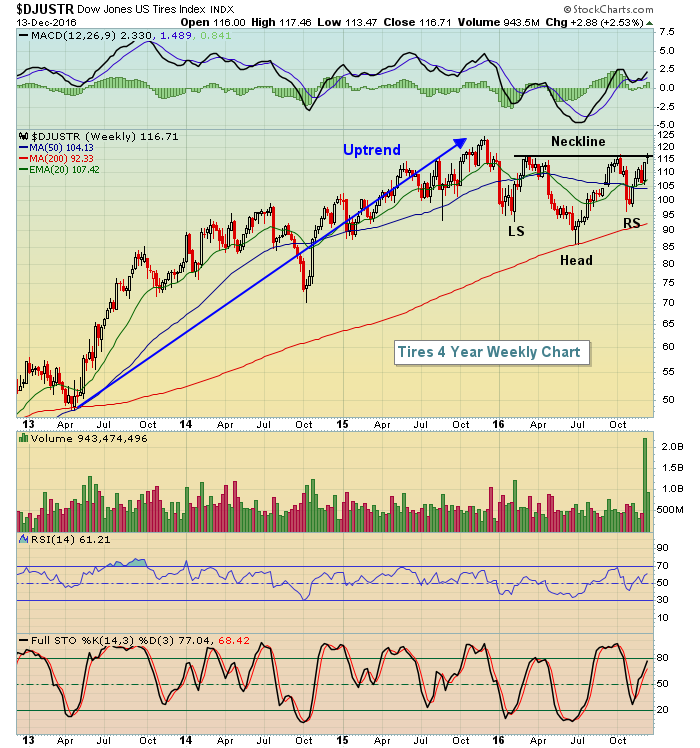
The Dow Jones U.S. Tires Index ($DJUSTR) has been a relatively weak industry group since topping in late 2015, but its recent strength has it challenging neckline resistance in a very bullish inverse head & shoulders pattern. Check it out:
 A breakout would measure to 145 in time so there is likely to be significant profits in the days and weeks ahead.
Historical Tendencies
Here's a breakdown of the Russell 2000 historically (since 1987) during the month of December:
1st through 15th: up 160 days, down 151 days, annualized return -4.98%
16th through 31st: up 198 days, down 105 days, annualized return +77.90%
It truly is the tale of two periods and we're about to end the first.
Key Earnings Reports
None
Key Economic Reports
November PPI released at 8:30am EST: +0.4% (actual) vs. +0.2% (estimate)
November Core PPI released at 8:30am EST: +0.4% (actual) vs. +0.2% (estimate)
November retail sales released at 8:30am EST: +0.1% (actual) vs. +0.4% (estimate)
November retail sales ex-auto released at 8:30am EST: +0.2% (actual) vs. +0.4% (estimate)
November industrial production to be released at 9:15am EST: -0.2% (estimate)
November capacity utilization to be released at 9:15am EST: 75.0% (estimate)
November business inventories to be released at 10:00am EST: +0.0% (estimate)
Happy trading!
Tom


