Market Recap for Wednesday, December 14, 2016
As expected, volatility kicked in around 2pm EST yesterday as the Fed delivered what traders most likely anticipated, but still didn't want to hear. Rates are going higher. Everyone was looking for the 25 basis point hike so that didn't startle anyone. However, the Fed did increase its number of expected rate hikes for 2017 from two to three and that's what created some of yesterday's angst. Honestly, I wasn't at all surprised by the more hawkish tone as the bond market has been building in multiple rate hikes ahead and the bond market usually gets it right. Since the FOMC 2pm EST announcement, treasuries have sold hard with the 10 year treasury yield ($TNX) moving into fresh new high territory. The TNX closed at 2.53%, it highest close in more than two years. In early action today, it's more of the same as the TNX is currently at 2.59%. Check out the 60 minute chart:
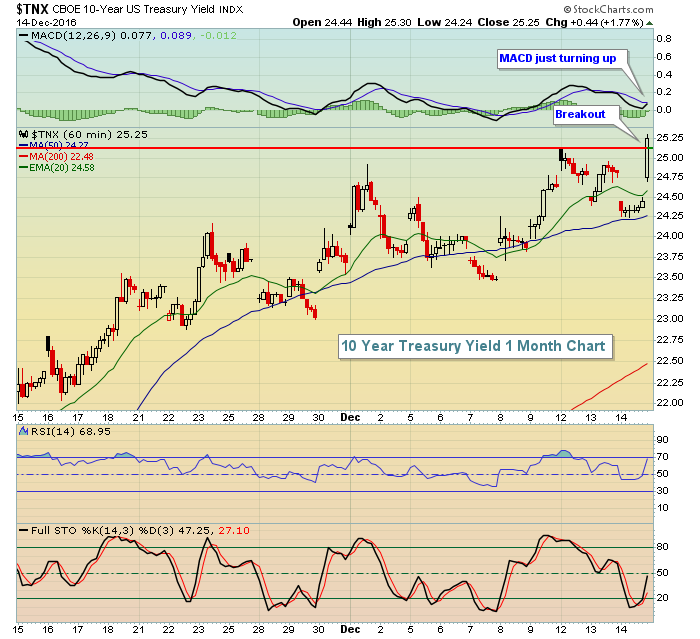 Short-term momentum is just beginning to build again, but from a more intermediate-term perspective, I'm looking for 3.0% on the TNX. Check out the next key yield resistance on this chart:
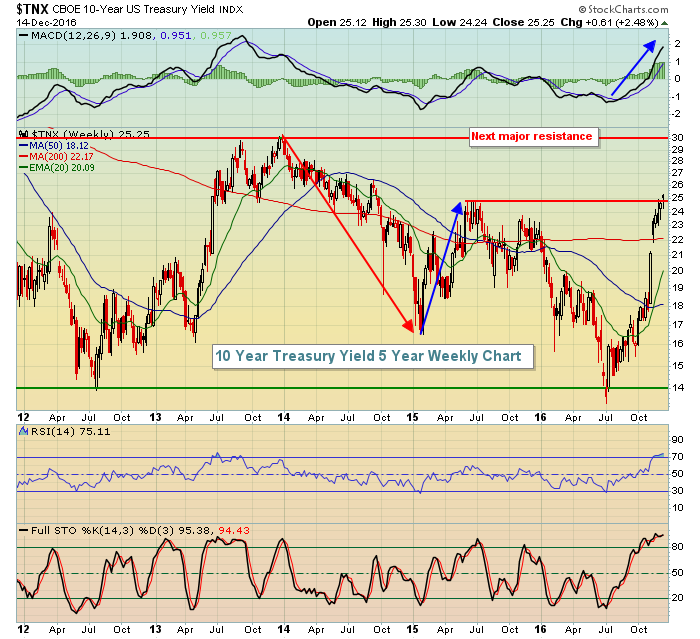 The yield has risen in parabolic fashion off the post-Brexit low just beneath 1.40%, nearly doubling in the past 5-6 months. But there's really little overhead resistance now that 2.50% has been cleared. The long-term series of lower highs and lower lows could be changed if the TNX moves back above 3.0%. I'd look for equities to handle the higher rates in stride up to 3.0%. Beyond that? We'll have to see and re-evaluate if necessary. For now, the selling of treasuries is likely to provide tail winds for equities.
Despite the selling in the final two hours yesterday, the "under the surface" signals remained bullish. In fact, three of the top four sectors on Wednesday were aggressive areas - technology (XLK, -0.35%), financials (XLF, -0.47%) and consumer discretionary (XLY, -0.68%) - while the defensive utilities (XLU, -2.06%) was the weakest sector. Energy (XLE, -2.00%) also performed poorly as the price of crude oil ($WTIC) fell back to $51 per barrel. I've provided the key support on crude in the Sector/Industry Watch section below.
Pre-Market Action
One key theme continues on. Investors are selling treasuries. This morning, the 10 year treasury yield ($TNX) is up another 6 basis points to 2.59% and the question will be whether money coming out of treasuries finds its way into equities. Thus far, that is not the case as futures are pointing to a flat open. We had gotten ahead of ourselves and the 60 minute negative divergence on the S&P 500 was illustrated in my blog yesterday. With a bit more weakness today, that will no longer be a momentum issue. Should the S&P 500 close below 2245, then the rising 20 day EMA could come into play and that moving average is currently at 2217.
Hong Kong's Hang Seng Index ($HSI) was very weak overnight, but otherwise key global markets were close to their respective flat lines and that seems to be carrying over to the U.S. as we being a new trading day.
Current Outlook
Historically, December is a great month for U.S. equities. On a relative basis, however, none of our major indices performs better than the Russell 2000 during the month of December. And as I posted in my blog yesterday, December is truly a tale of two periods with respect to historical annualized returns. The second half of December is extremely bullish while the first half of December usually has its struggles. Well, today is December 15th so the second half of December officially kicks off tomorrow. I'll be watching the relationship of small cap stocks vs. the benchmark S&P 500 ($RUT:$SPX) to see if we witness yet another new relative high in 2016. If so, it would be bullish for equities. Here's the current relative ratio chart:
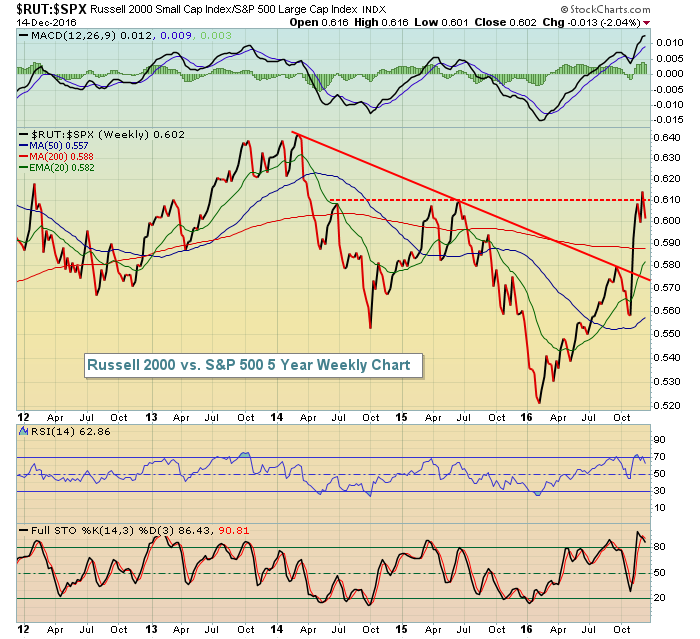 The two and a half year relative downtrend line (solid red line) was broken recently, suggesting that we're now in a period of small cap relative strength. But it's important to clear relative strength resistance that was established near the .61 level (red dotted line). Small caps typically outperform in a very big way in the second half of December, so I'll be watching to see if we can get a relative strength breakout. If so, that should add to the bullishness of this U.S. stock market rally as we enter 2017.
Sector/Industry Watch
Crude oil ($WTIC) had just recently broken out of ascending triangle (short-term) and reverse head & shoulders (intermediate-term) patterns and appeared poised to surge much higher. So what happened? Well, pulling back to test key support levels after a breakout is not uncommon. I'm not changing my bullish forecast for crude oil and for the energy space in general based on the past couple days of weakness. Instead, I believe this pullback is creating opportunities for those on the sidelines to get on board. Here's a look at the daily chart and key support:
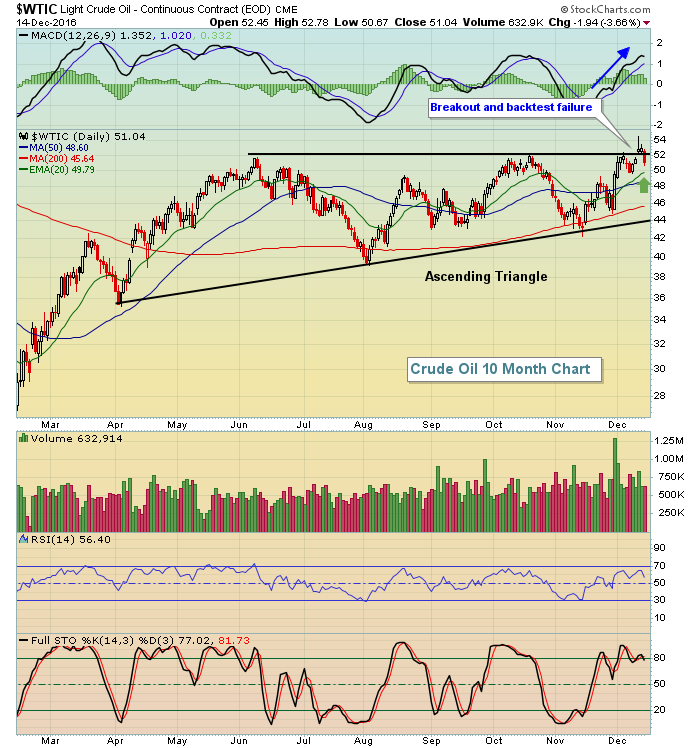 The momentum in crude oil prices is very bullish as you can see from the MACD (blue line with arrow). Typically, when momentum is strong like that, the rising 20 day EMA (green arrow) provides solid support. Currently, the 20 day EMA is at 49.79 and that will be a level I'll watch closely to keep the ascending triangle pattern (and measurement) intact.
Historical Tendencies
If energy remains a relative leader, as I expect it will, then the Dow Jones U.S. Coal Index ($DJUSCL) could benefit in a big way. The following is a seasonal chart for the DJUSCL over the past 16 years:
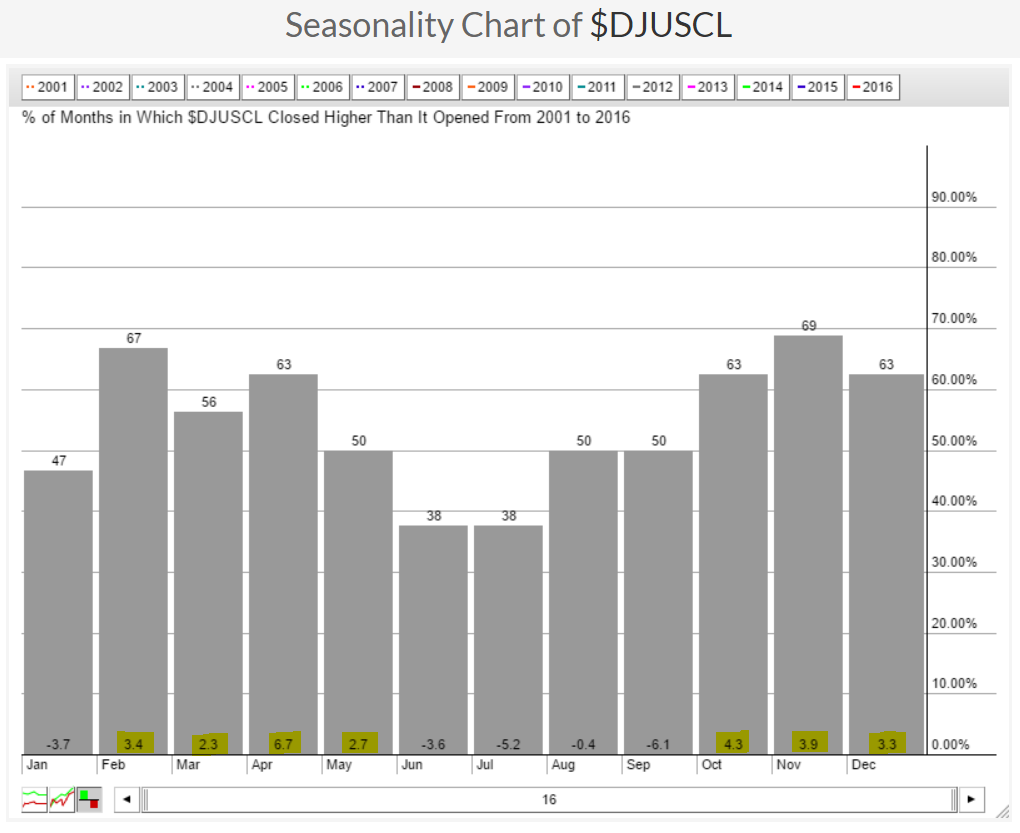 The yellow highlighted numbers at the bottom of each calendar month from October through May (January is an exception) show average monthly returns. Coal really struggles over the summer months, but tends to perform exceptionally well the balance of the year, again with January the exception.
Key Earnings Reports
(reports after close, estimate provided):
ADBE: .72
JBL: .58
ORCL: .56
Key Economic Reports
Initial jobless claims released at 8:30am EST: 254,000 (actual) vs. 255,000 (estimate)
November CPI released at 8:30am EST: +0.2% (actual) vs. +0.2% (estimate)
November Core CPI released at 8:30am EST: +0.2% (actual) vs. +0.2% (estimate)
December Philadelphia Fed Survey released at 8:30am EST: 21.5 (actual) vs. 10.0 (estimate)
December Empire State Manufacturing Survey released at 8:30am EST: 9.0 (actual) vs. 3.0 (estimate)
December housing market index to be released at 10:00am EST: 63 (estimate)
Happy trading!
Tom


