Market Recap for Tuesday, January 3, 2017
Healthcare (XLV, +1.31%) took over sector leadership on Tuesday to open 2017 as the Dow Jones U.S. Biotechnology Index ($DJUSBT) jumped 2.05%. It's not too surprising to historians as January tends to be very kind to both the healthcare sector and to biotechs more specifically. Over the past 20 years, the XLV has outperformed the S&P 500 in January 15 times and the sector's average January outperformance is 1.6%, meaning that if the S&P 500 rises 1.0% for the month, the XLV theoretically jumps 2.6%. Considering that's an average over a lengthy period, it's certainly worth noting. Biotechs have averaged outperforming the S&P 500 by a 2.0% margin over that same period.
Perhaps the strangest action on Tuesday took place in energy (XLE, +1.13%) where the sector benchmark posted solid gains despite a big reversal in crude oil prices ($WTIC), which tumbled back to $52.33 per barrel, or 2.59% lower, after trading above $55 per barrel earlier in the session. Don't expect the XLE to respond well to a continuing decline in the WTIC so I'd keep a close eye there. From a longer-term weekly perspective, the WTIC should find excellent support in the $49-$50 per barrel range. Yesterday's reversal was surprising, however, as the rising 20 day EMA quickly came into play. Check out the visual:
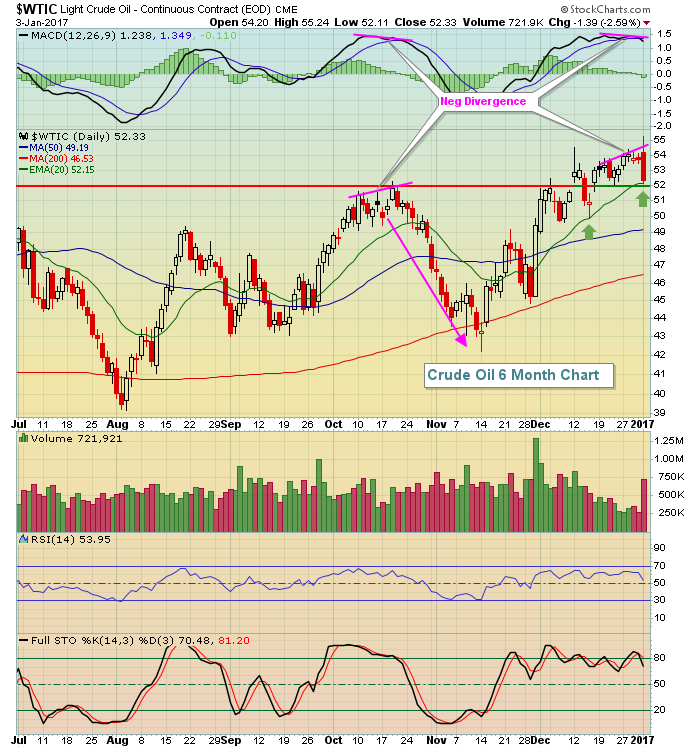 This is a little scary because the last time that crude oil printed a negative divergence on its daily chart, it was followed with a big selloff. The difference this time, in my view, is that we've seen a breakout on the longer-term weekly chart with a measurement to the $75 per barrel area. At the time that last negative divergence printed, crude oil prices were at $52 per barrel, which represented neckline resistance on the weekly chart. So both charts were arguing for a pullback. Now, the weekly chart actually suggests the highest likelihood is a reversal at that neckline support at $52 per barrel with an outside chance the WTIC tests the rising 20 week EMA, closer to $49 per barrel.
Pre-Market Action
U.S. futures are pointing higher after Asian markets finished mostly higher overnight and European markets are mixed this morning. Tokyo's Nikkei Index ($NIKK) surged 2.5% overnight to close at its highest level in a year and the timing was perfect technically as the NIKK had just tested its rising 20 day EMA the night prior.
Dow Jones futures are up 42 points a half hour from the opening bell and crude oil prices have stabilized with slight gains this morning after their big Tuesday reversal.
The 10 year treasury yield ($TNX) resides almost squarely on its 20 day EMA, which is significant because there's a negative divergence in play. Further deterioration would suggest a 50 day SMA test, currently at 2.25%. A drop to that level would almost certainly encourage further profit taking in the financial (XLF) space. That might prompt more rotation into other sectors like healthcare and energy, both of which tend to perform very well in January.
Current Outlook
The benchmark S&P 500 has struggled since printing that negative divergence on its 60 minute chart in mid-December. It's been in consolidation mode with a trading range of 2215-2280. Until that breaks, look for more of the same. Here's the chart:
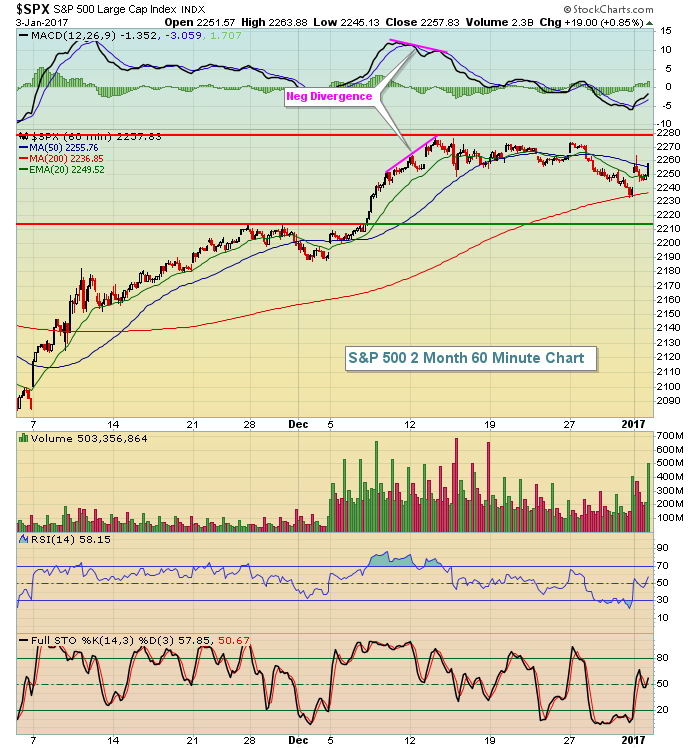 The 60 minute chart really tells me little, except to highlight the fact that we haven't retested the breakout level near 2215. The daily chart (not pictured here) saw us climb back above the 20 day EMA after briefly losing that moving average to end 2016. Keep one thing in mind. Should the S&P 500 break above the price resistance at 2280 - and I believe it will - the daily chart will begin flashing a nasty negative divergence where we could see a 50 day SMA test on this index. Currently, the 50 day SMA is rising and at 2197. That breakout and negative divergence could be the signal that we'll see a longer period of selling and a test of that 2215 breakout level. For now, I remain bullish U.S. equities.
Sector/Industry Watch
Recently I discussed the short-term possibilities of gold (GLD) moving higher on the heels of a positive divergence that had formed on its daily chart. While that positive divergence has been eliminated, the weekly chart still shows the declining 20 week EMA several points higher and there's still an outside chance that GLD reaches that key moving average. Here's the weekly chart:
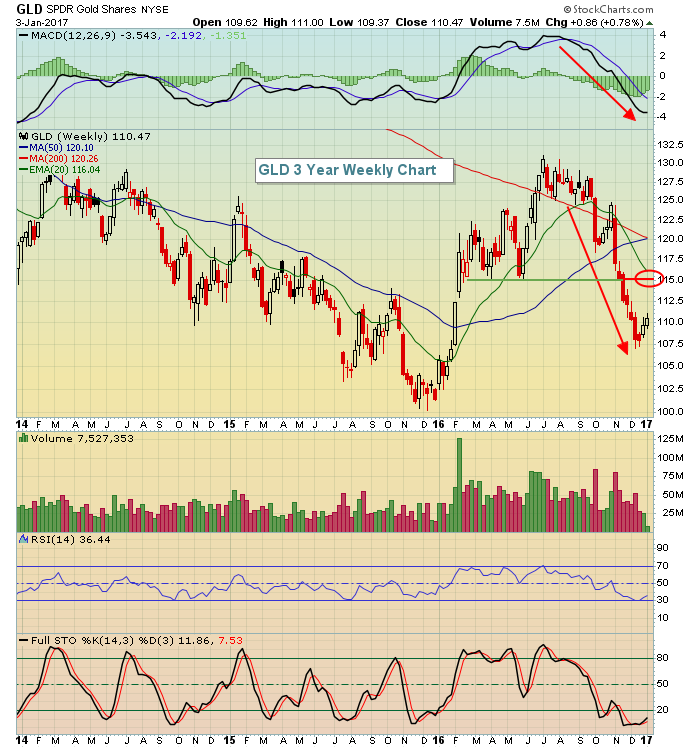 The red arrows show that with the big price decline, the weekly MACD tumbled and was at a low at the most recent price low. That suggests that sellers have the momentum on their side and that a 20 week EMA test is likely to provide major resistance. Now there's no guarantee that the GLD will get to the 20 week EMA and the metal is in a severe long-term downtrend so it's not an area of the market I would trade on the long side, but there is still upside potential in the near-term. Personally, I'd be out of the GLD on a 20 week EMA test and, to take it a step further, I'd short the GLD at that moving average if I was forced to trade it.
Historical Tendencies
Since 1971, the NASDAQ has produced differing annualized returns based on the period of the calendar month (all calendar months, not just January). Check out these annualized returns by period:
28th through 6th: +24.86%
7th through 10th: -2.52%
11th through 18th: +17.33%
19th through 27th: -4.32%
Key Earnings Reports
None
Key Economic Reports
FOMC minutes released at 2pm EST
Happy trading!
Tom


