Market Recap for Wednesday, January 4, 2017
Materials (XLB, +1.46%) and consumer discretionary (XLY, +1.33%) were easily the two best performing sectors on Wednesday to lead our major indices to a second consecutive day of across-the-board gains in 2017. There is a very strong correlation between January performance and performance the balance of the calendar year, so the strength thus far is noteworthy.
The Russell 2000 ($RUT, +1.64%) surged to gains that nearly tripled those of the benchmark S&P 500 ($SPX, +0.57%). 1388.07 is the recent high close on the RUT and yesterday's close was 1387.95. Therefore, the RUT will be looking for breakout territory today. I don't typically post monthly charts because I'm a short-term trader, but I do find the longer-term monthly chart on the RUT to be very interesting. Check this out:
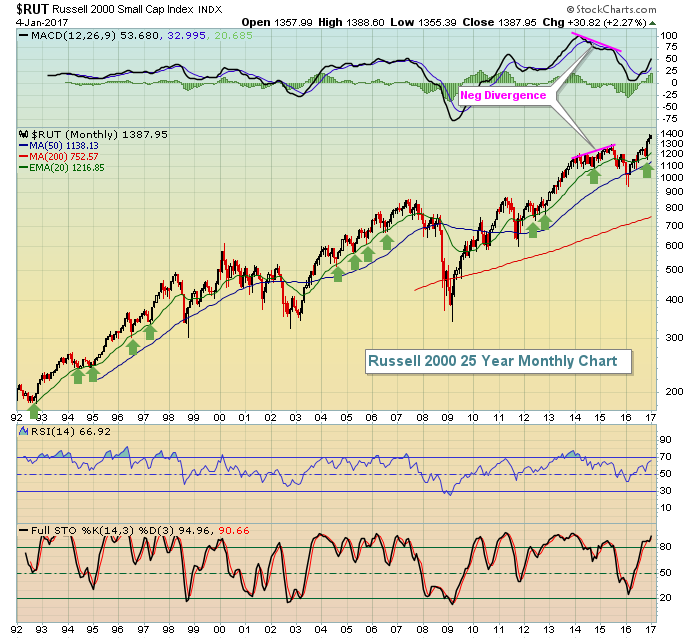 I always talk about how rising 20 period EMAs offer tremendous support on every time frame and I think it's illustrated perfectly here with this long-term monthly chart on the RUT. Those green arrows show how that key moving average can be used if you prefer looking at the stock market using a "buy and hold" methodology. When I see a negative divergence, I no longer expect rising 20 period EMAs to provide support and you can see how this worked after a negative divergence printed on the higher high in 2015. If you want to know why the RUT underperformed the benchmark S&P 500 so badly throughout the second half of 2015, I'd look no further than this chart.
The Dow Jones U.S. Steel Index ($DJUSST) helped to lead the basic materials sector yesterday after it recently battled a negative divergence of its own. Take a look at the bounce yesterday and what steel was facing about four weeks ago:
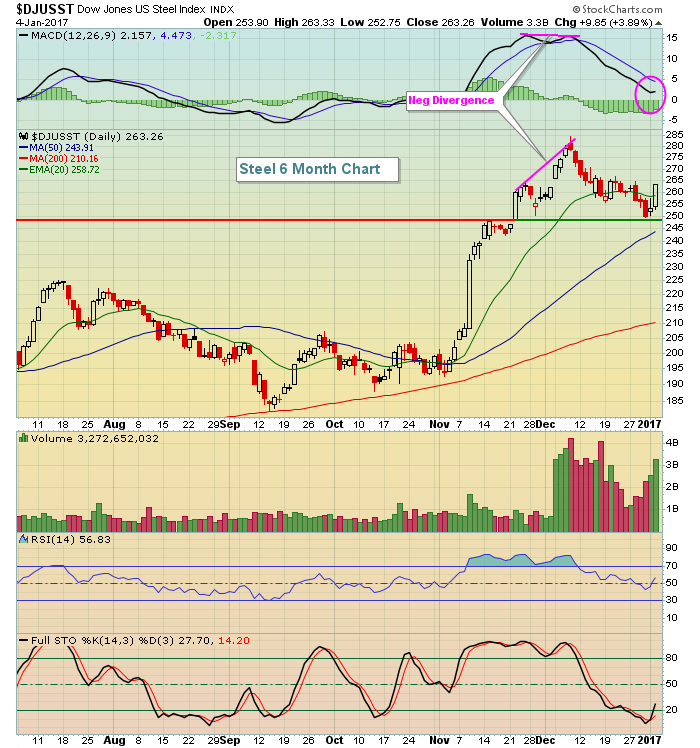 While we haven't seen the DJUSST test its 50 day SMA, the negative divergence did result in the MACD nearly testing its centerline (pink circle). Key price support currently resides at about 249 and the rising 50 day SMA is at 244. After steel fell from 285 to 250, the reward to risk certainly shifted much more favorable for the bulls so Wednesday's spike should not be a shocker.
Automobiles ($DJUSAU) rose 4.67% to break out and lead the consumer discretionary space higher. That industry group is featured below in the Sector/Industry Watch section below.
Pre-Market Action
U.S. futures are pointing to a bit of profit taking at the open today with Dow Jones futures down 6 points with 30 minutes to go before the opening bell. The ADP employment report came up short of estimates a day before the more closely watched government nonfarm payrolls report will be released. Initial jobless claims fell and came in well below forecasts so it depends what traders want to focus on this morning.
Kohls (KSS) and Macy's (M) set the stage after the bell on Wednesday for a brutal open today for many retailers. KSS said that its same store sales for November and December declined 2.1% year over year. And then Macy's put the hammer down with its announcement that it is cutting 6200 employees and shutting down 68 stores. These two announcements will likely have a ripple effect in the industry group.
Hong Kong's Hang Seng Index ($HSI) had another huge session overnight, rising another 322 points while action in Europe this morning is mixed.
Current Outlook
An increase in the level of fear is necessary to trigger a more significant bout of selling. The Volatility Index ($VIX) represents the expected volatility over the next 30 days. Its a weighted blend of prices for a range of S&P 500 options and is expressed in percentage terms. For example, today's VIX reading near 12 suggests that the market is expecting the S&P 500 to climb or decline 12% over the coming year. To calculate the market's expectation of volatility over the next 30 days, you divide the 12 not by 12, but rather the square root of 12. Doing so suggests that the market is looking for a 3-4% move in either direction over the next 30 days.
That's a very quick and simplified explanation of the VIX, but it's much more complicated than that. A rising VIX indicates that the stock market is expecting much more volatility and volatility is normally associated with falling prices as the market tends to be very complacent during bull market advances. Until traders expect more volatility, the bulls will remain in charge. So in evaluating market sentiment, I look to absolute prices of the VIX for breakouts to warn of impending market corrections. Currently, the short-term resistance level of the VIX to watch is just below 15 while any move in the VIX to the 11 level would accompany and favor bullish market behavior. Here's the current view of the VIX:
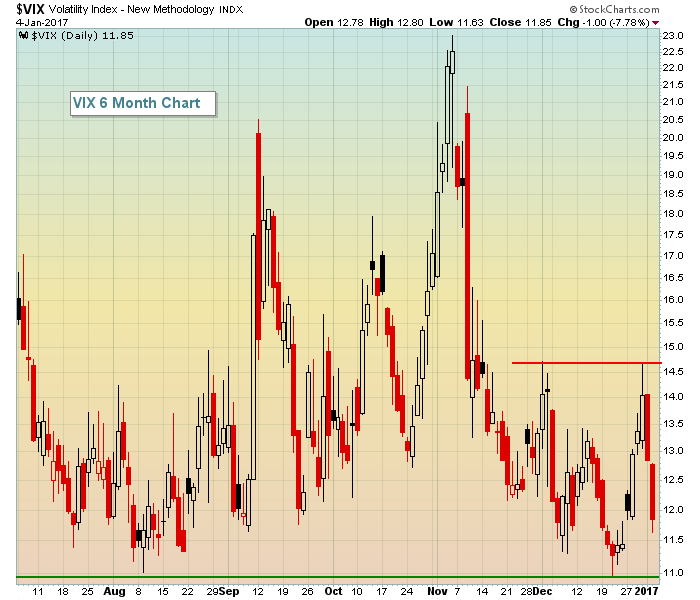 Note that I've removed moving averages and momentum oscillators from this chart. I think they're pointless as both are used to follow trends. The VIX really doesn't trend. It typically moves higher very quickly, then comes right back down as fear subsides. During bear markets, the VIX remains elevated as the last two bear markets never saw a VIX reading below 16-17. Closing just beneath the 12 level on Wednesday hardly suggests we need to worry about a bear market at present.
Sector/Industry Watch
The Dow Jones U.S. Automobiles Index ($DJUSAU) exploded on Wednesday to break its bull wedge on its daily chart (not shown in chart below), but more importantly to continue its bullish advance on its weekly chart. Check this out:
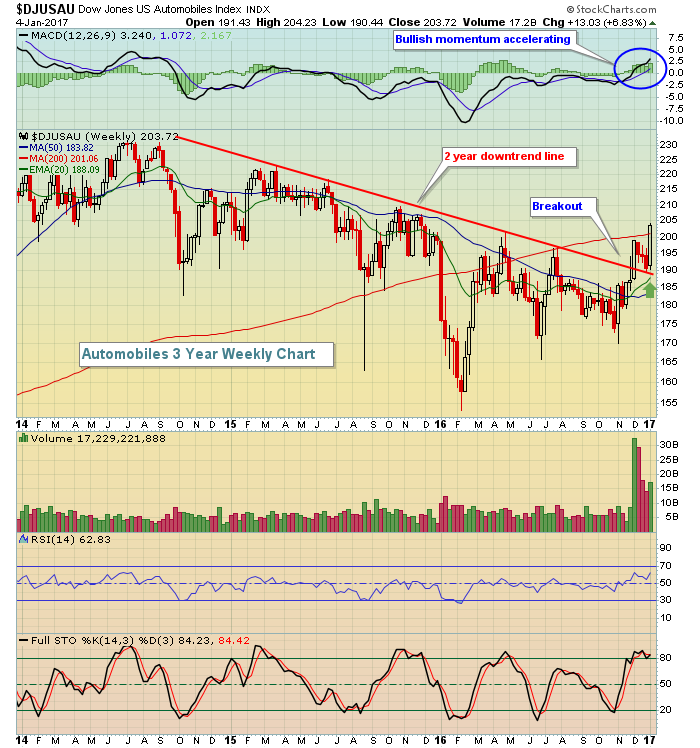 I believe the 2+ year downtrend has ended on automobiles and pullbacks to test that rising 20 week EMA would represent excellent high reward to risk entry points into key stocks within the space. Technically, General Motors (GM) looks as solid as any of the big automakers.
Historical Tendencies
During my Bowley Briefing webinar yesterday, I spent most of the webinar discussing seasonal tendencies that every trader should be aware of. Rather than repeat pieces of it here, please review the webinar and this discussion at your leisure. You can CLICK HERE for the recording.
Key Earnings Reports
(actual vs. estimate):
MON: .21 vs (.04)
RPM: .52 vs .60
STZ: 1.96 vs 1.70
Key Economic Reports
December ADP employment report released at 8:15am EST: 153,000 (actual) vs. 172,000 (estimate)
Initial jobless claims released at 8:30am EST: 235,000 (actual) vs. 260,000 (estimate)
December ISM non-manufacturing index to be released 10:00am EST: 56.8 (estimate)
Happy trading!
Tom


