Market Recap for Wednesday, January 18, 2017
Financials (XLF, +0.83%) were back on track Wednesday as mortgage finance ($DJUSMF), life insurance ($DJUSIL), investment services ($DJUSSB) and banks ($DJUSBK) led the equity charge. It was a bifurcated day with the Dow Jones retreating, but the S&P 500, NASDAQ and Russell 2000 all finished higher - with the latter two aggressive indices outperforming again. On the daily chart, the NASDAQ 100 looks the best technically with its recent breakout and strong momentum. Have a look:
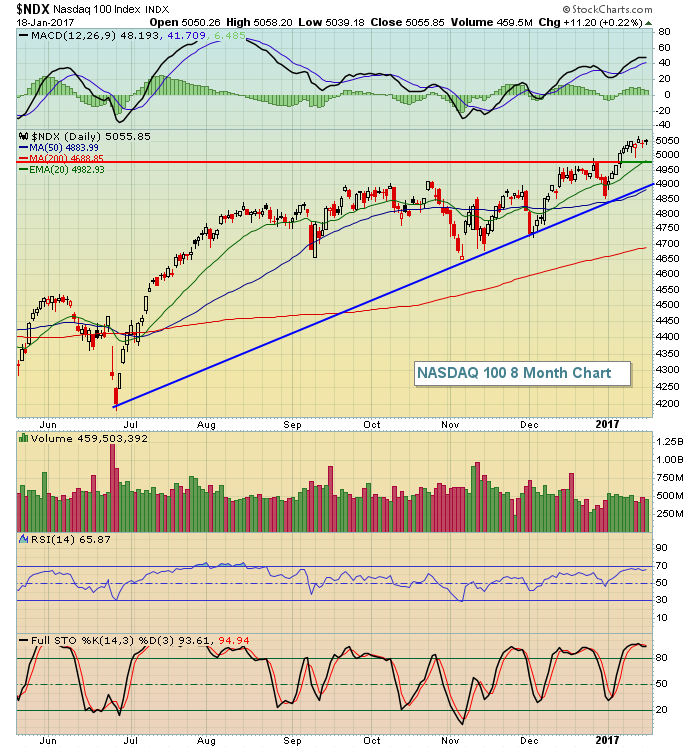 The daily MACD continues to surge higher as prices have broken out. The two key short-term support levels here are at the rising 20 day EMA and trendline support, currently at 4983 and 4900, respectively. For now, I'd look for those support levels to hold during any period of short-term selling.
Consumer stocks took a breather on Wednesday, but are among the leading sector performers over the past week with staples stocks (XLP, +1.73%) and discretionary stocks (XLY, +0.26%) two of the three sectors with gains over this period. Utilities (XLU, +0.91%) represent the only other sector with gains over the past week. Normally, consumer staples and utilities leading the market is a warning sign, but keep in mind the benchmark S&P 500 is consolidating and has really gone nowhere recently. Therefore, we're simply seeing rotation rather than a warning sign in my view. There's more on consumer stocks in the Sector/Industry Watch section below.
Pre-Market Action
Tokyo's Nikkei ($NIKK) showed strength overnight, but other major global indices in Asia and in Europe are close to the flat line. The U.S. is currently following suit with the Dow Jones futures down 8 points with just 30 minutes left to the opening bell.
Earnings reports are beginning to pick up with this morning's economic reports mostly better than expected.
There are plenty of treasury sellers this morning with the 10 year treasury yield ($TNX) spiking more than six basis points to 2.45%. That should bode well for interest-sensitive financial stocks like banks and life insurance companies.
Current Outlook
The NASDAQ 100 has been leading the major indices of late, particularly the Dow Jones and S&P 500. Below is a very short-term look at key support and resistance levels on the NDX:
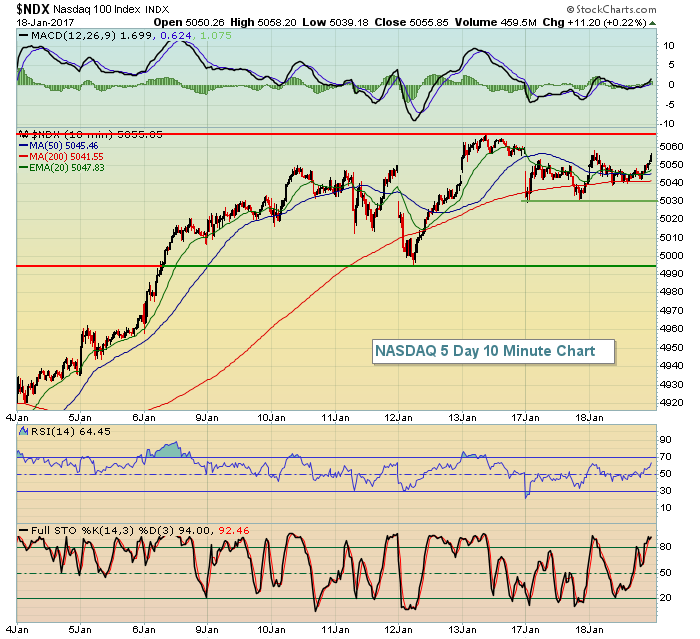 5030 is the initial support level to watch. Should that price level fail, the rising 20 day EMA support on the daily chart (not shown above) at 4983 would be next. Note that the 20 day EMA isn't too far from the other price support level shown above at roughly 4995.
Sector/Industry Watch
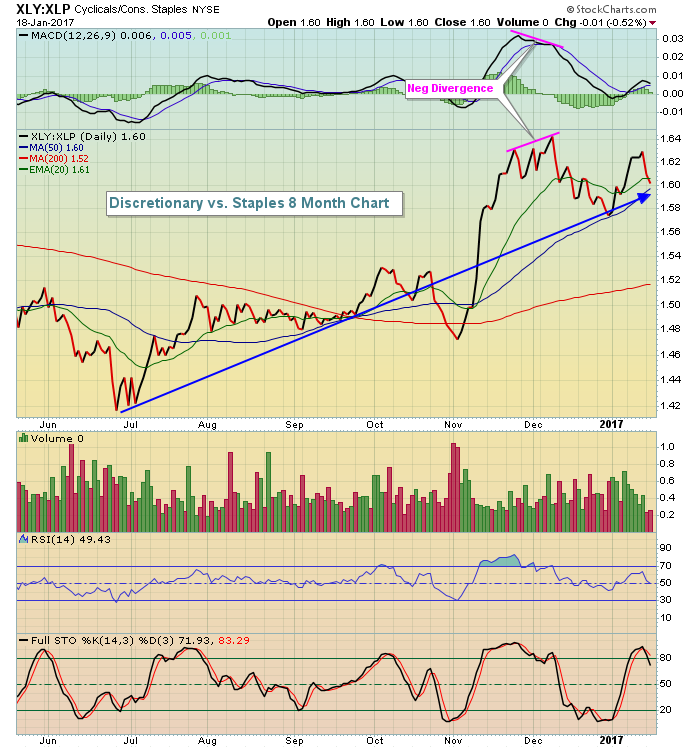
The aggressive XLY:XLP ratio has been strong since the late June (post-Brexit) lows. This tells us that investors are opting for the more aggressive consumer discretionary stocks, which tends to support and sustain a bull market rally. Check out the solid uptrend:
 The very short-term relative struggle can be explained by a few factors. First, there's a relative negative divergence in play that suggested the relative outperformance was long in the tooth. Second, the recent relative decline accompanied a period of consolidation in the benchmark S&P 500, which is quite normal. Finally, consumer discretionary stocks have hit a key price resistance area after successfully testing and bouncing off price support. Take a look at the XLY:
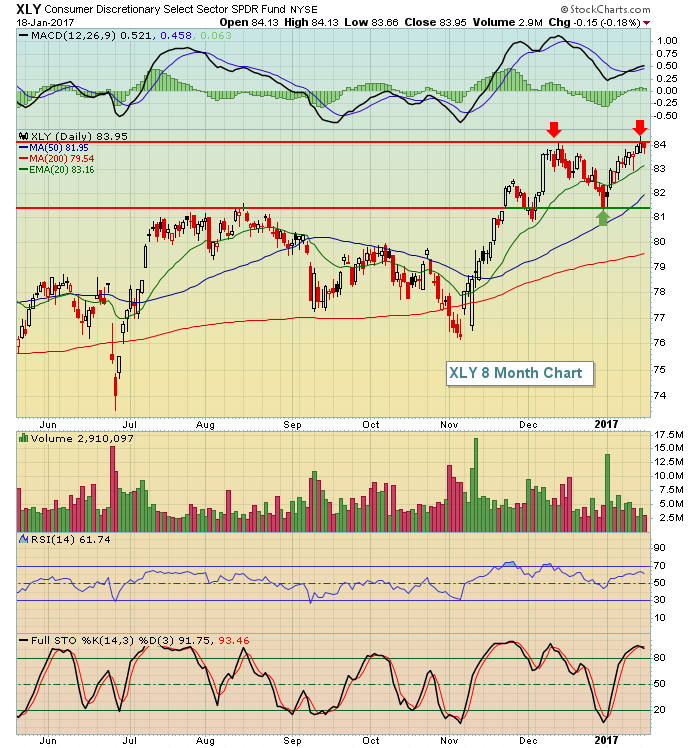 Let's see where the XLY goes from here. I expect that we'll see a breakout above 84.25 before we'll see a breakdown beneath 81.40, but for now that's the trading range.
Historical Tendencies
January 19th through 24th tends to see a retreating S&P 500, at least that's been the tendency over the past 67 years. It's not been a major bearish period as the annualized return has been -12.36% so I look at it as a period where we typically consolidate historical gains that occur just prior to this period.
Key Earnings Reports
(actual vs. estimate)
BBT: .73 vs .73
BK: .77 vs .78
CHKP: 1.33 vs 1.15
JBHT: .97 vs 1.00
KEY: .31 vs .29
MTB: 2.01 vs 2.03
PPG: 1.19 vs 1.19
UNP: 1.39 vs 1.34
WBS: .60 vs .55
(reports after close, estimate provided):
AXP: .98
IBM: 4.89
LUV: .68
SWKS: 1.48
Key Economic Reports
December housing starts released at 8:30am EST: 1,226,000 (actual) vs. 1,200,000 (estimate)
December building permits released at 8:30am EST: 1,210,000 (actual) vs. 1,230,000 (estimate)
Initial jobless claims released at 8:30am EST: 234,000 (actual) vs. 255,000 (estimate)
January Philadelphia Fed Survey released at 8:30am EST: 23.6 (actual) vs. 16.0 (estimate)
Happy trading!
Tom


