Market Recap for Tuesday, January 17, 2017
Money rotated towards defense on Tuesday as our major indices saw a day of profit taking. The small cap Russell 2000 was hit particularly hard, dropping 1.44%. But all of the key indices were lower as the banks' failure to break out on heavy volume Friday came back to haunt them yesterday. The Dow Jones U.S. Banks Index ($DJUSBK) tumbled 3.36% in what was easily their worst day of trading since the huge run up began in early November. Take a look at the short-term technical damage inflicted:
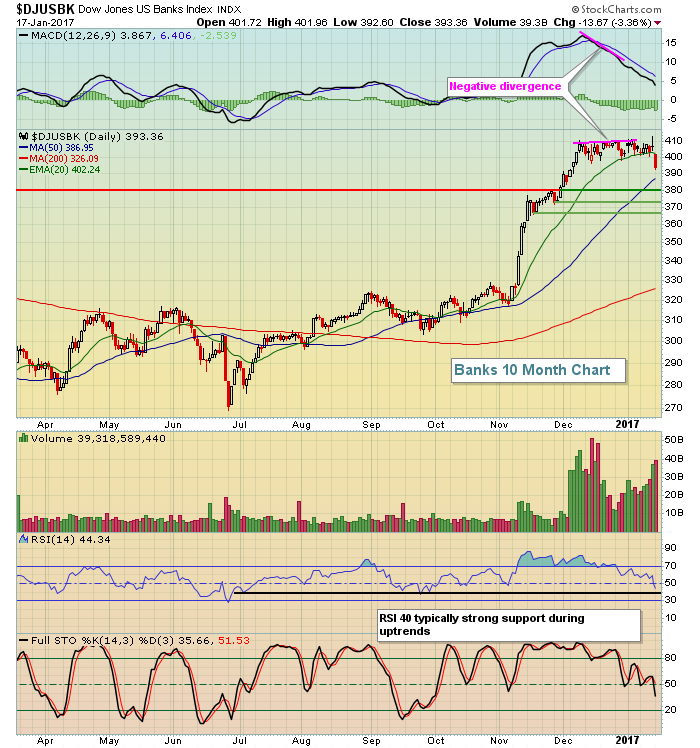 I've discussed the risks of chasing banks when the group's RSI is in the 70s and 80s. Well, we've finally seen some profit taking and the RSI has dropped into the mid-40s. The key price support levels are marked above with the green horizontal lines. Also, note that the banks' most recent attempt to clear the early January high is accompanied by a negative divergence, indicative of a likely MACD centerline and/or 50 day SMA test.
While money was rotating away from aggressive areas of the market, defensive-oriented areas like consumer staples (XLP, +1.42%) and utilities (XLU, +1.09%) performed much better. Tobacco ($DJUSTB) was a prime beneficiary and is featured below in the Sector/Industry Watch section.
Pre-Market Action
There still aren't a lot of companies reporting (38 today), but several are large cap stocks and are quite meaningful to the direction of short-term price action in the overall market. For instance, today we have Citigroup (C), Goldman Sachs (GS) and Netflix (NFLX), which will have direct impacts on the performance of the Dow Jones, S&P 500 and NASDAQ indices.
Dow futures are currently higher by 31 points about 40 minutes from the opening bell. The 10 year treasury yield ($TNX) is rising for the second time in the past three days. That hasn't happened since the top near 2.60% back in mid-December so perhaps we're seeing a reversal back to the upside in the TNX. That would benefit banks and life insurance companies just as those two industry groups experience significant short-term weakness for the first time since early November rally began.
Current Outlook
The S&P 500 does have a negative divergence on its daily chart, which could result in a test of its rising 50 day SMA, currently at 2222.70. Such weakness would also be well-received technically on its weekly chart as momentum there is quite strong with a rising 20 week EMA currently at 2207.24. Therefore, should we see selling accelerate over the next week to ten days - quite possible with the impending inauguration - the 2207-2222 moving average support levels could be tested. Here's the longer-term bullish weekly chart:
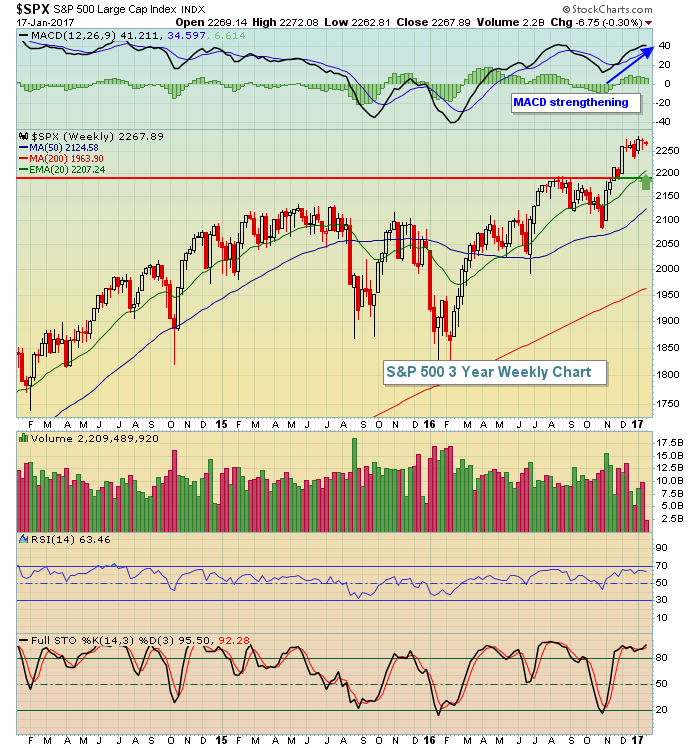 The important thing to keep in mind here is that longer-term technical outlooks trump short-term - at least in my view. So I weight the long-term bullish view much heavier, but recognize in a big picture outlook that the daily negative divergences could result in short-term weakness to set up better long-term reward to risk trading candidates.
Sector/Industry Watch
The Dow Jones U.S. Tobacco Index ($DJUSTB) surged nearly 2% on Tuesday, breaking an intermediate-term downtrend line in the process. Check out the technical improvement:
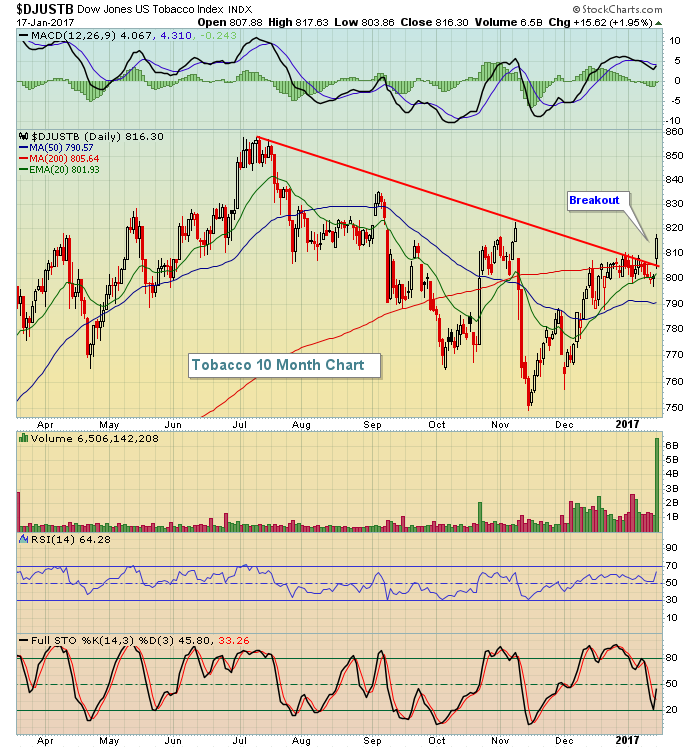 Trendlines are very subjective as you can connect any two points along a chart and call it a trend and that "trend" can quickly change by connecting a different two price points. So trendlines tend to be much more reliable with 3, 4 or 5 or more price points connected. Still, the above chart not only broke what appears to be an intermediate-term trendline, but it did so with heavy volume and one of its heaviest weighted components - Altria (MO) - nearly breaking out on heavy volume as well. Another bullish consideration is the historical performance that tobacco stocks typically enjoy as they head out of January. Check out the Historical Tendencies section below for more details.
Historical Tendencies
As mentioned above, tobacco stocks are about to enter a seasonally strong period of the calendar year. Check out the following seasonal chart:
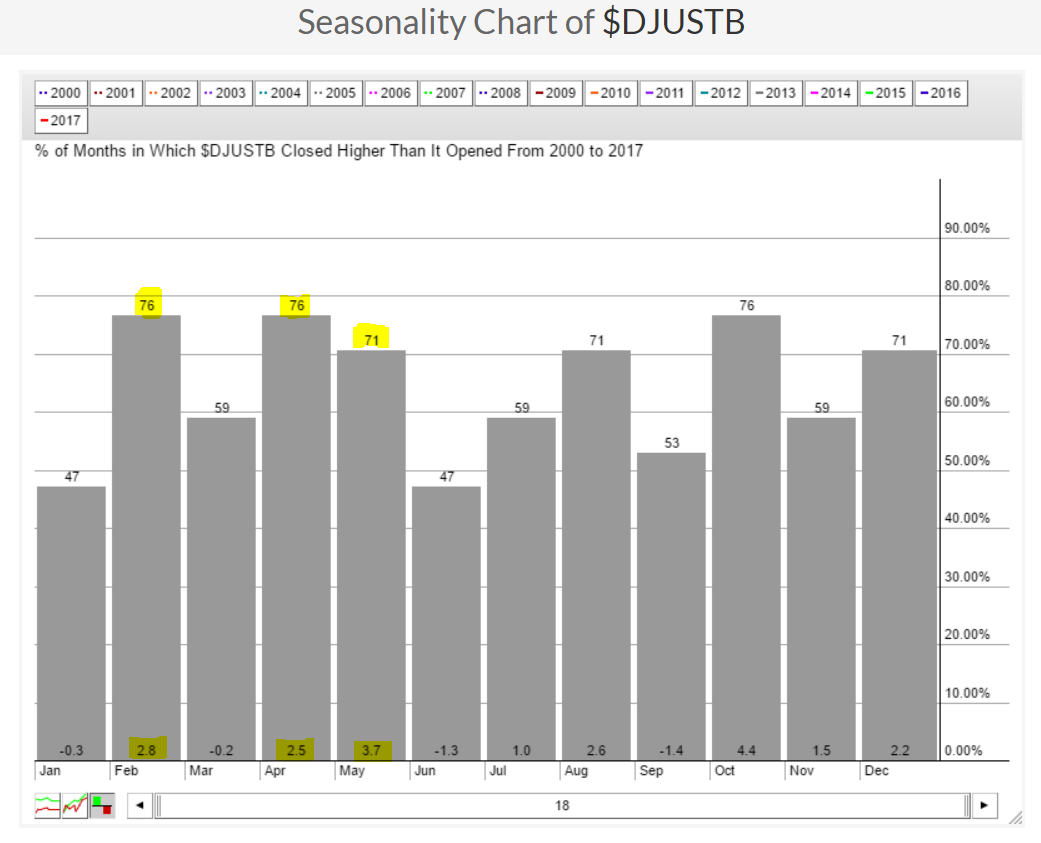 Alone I wouldn't pay too much attention to seasonal patterns because they provide us tendencies, not guarantees. But strong seasonal periods combined with technical outlook improvement is powerful in my view. Knowing that the DJUSTB is entering a seasonally strong period while also improving technically suggests this is a group I may want to consider adding to my portfolio through May - so long as technical conditions remain bullish.
Key Earnings Reports
(actual vs. estimate):
AMTD: .41 vs .41
ASML: 1.33 vs 1.06
C: 1.14 vs 1.12
FAST: .40 vs .38
GS: 5.08 vs 4.76
NTRS: 1.11 vs 1.14
USB: .82 vs .81
(reports after close, estimate provided):
CP: 2.38
KMI: .18
NFLX: .13
Key Economic Reports
December CPI released at 8:30am EST: +0.3% (actual) vs. +0.3% (estimate)
December Core CPI released at 8:30am EST: +0.2% (actual) vs. +0.2% (estimate)
December industrial production to be released at 9:15am EST: +0.6% (estimate)
December capacity utilization to be released at 9:15am EST: 75.4% (estimate)
January housing market index to be released at 10:00am EST: 69 (estimate)
Beige book to be released at 2pm EST
Happy trading!
Tom
