Market Recap for Thursday, January 5, 2017
The 10 year treasury yield ($TNX) tumbled on Thursday, dropping more than 8 basis points to close at 2.37% - its lowest daily close since December 7th's 2.35% finish. The sudden interest in treasuries could have been the result of a weaker-than-expected monthly ADP employment report, or perhaps the awful retail news from both Kohls (KSS) and Macy's (M). But honestly, technical indications predicted a bit more buying in treasuries given the positive divergence that had formed on the TLT daily chart. Have a look:
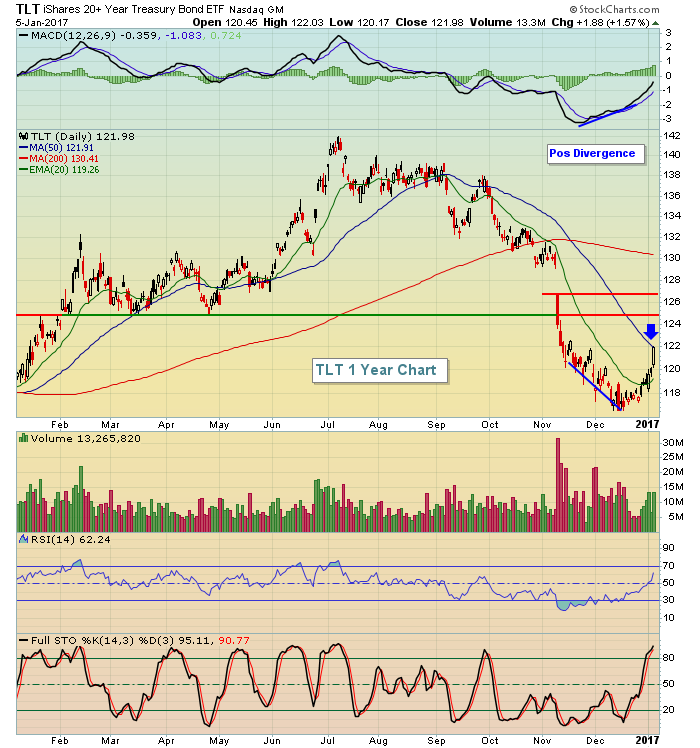 Thursday's close of 121.98 was just above its 50 day SMA, currently at 121.91. I look for 50 period SMA tests after positive and negative divergences form. Price momentum to the downside had slowed as the blue lines suggest so the recent strength is typical technical behavior. I've highlighted the three key levels of resistance - the blue arrow represents the 50 day SMA test, then the two red lines above highlight price resistance, then gap resistance. The reaction to today's nonfarm payrolls report will likely determine whether the "bigger picture" downtrend resumes or whether the treasury bulls have a little more gas in their tank.
The strength in treasuries has sent the corresponding yields lower as treasuries and treasury yields always move in opposite directions. The falling yields have resulted in exactly what you might expect - a weakening financial sector (XLF, -1.01%), especially banks ($DJUSBK) and life insurance ($DJUSIL). Despite the falling yields of late, both the DJUSBK and DJUSIL have held near their respective 20 day EMAs. The DJUSIL does have a negative divergence and could be poised technically for a further drop, especially if yields fall after today's nonfarm payrolls report. Be careful here, take a look:
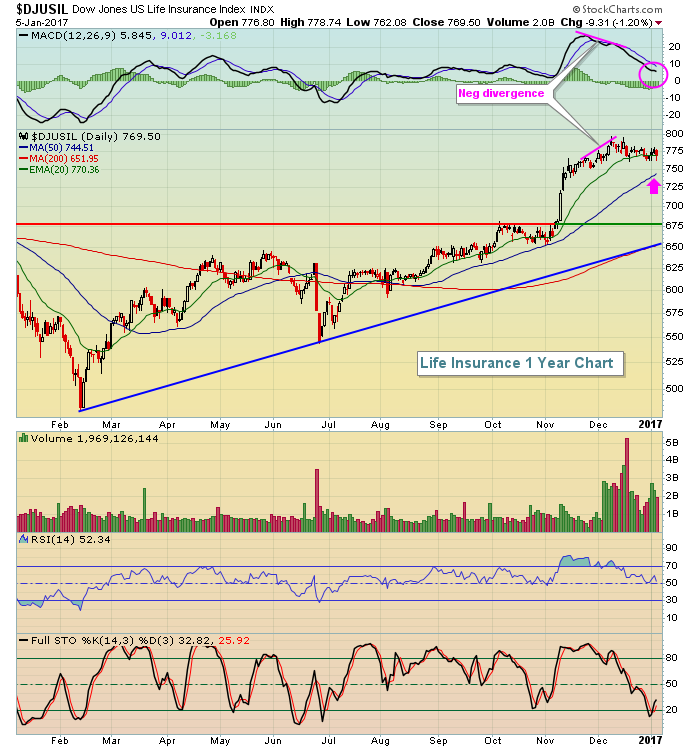 The DJUSIL closed just a fraction beneath its 20 day EMA and it has a negative divergence. Price support is close to 680 and the rising trendline is just above 650 so there's definitely more room to the downside. This is a very hot industry group and I'm not calling for a move to those levels, I'm just indicating that the risk of buying or holding these stocks has grown tremendously. Keep stops in place.
We finished Thursday with a bifurcated market as the NASDAQ was able to post a gain despite losses in the Dow Jones, S&P 500 and Russell 2000. Pharmaceuticals ($DJUSPR) continued their march toward 500 to lead healthcare (XLV, +0.54%) higher. In my December 12th Trading Places blog article (market recap section), I highlighted a key reversal in the pharmas and we've seen mostly strength ever since. In the Sector/Industry Watch section below, I highlight the current daily outlook on pharmas.
Pre-Market Action
U.S. futures are flat after the nonfarm payrolls report hit this morning. Like the ADP employment report yesterday, nonfarm payrolls came up short. After an initial drop in treasury yields, we've seen the TNX recover to post a gain to 2.40% so perhaps the market is poised to overlook the shortfall in jobs.
Overnight, the Hang Seng index ($HSI) continued its rally of late while other key Asian markets were lower. In Europe this morning, we're seeing slight losses on profit taking. The German DAX has printed a lower MACD on its latest price breakout, however, so negative divergences could hamper key global markets next week. Below I discuss a potential negative divergence emerging on the S&P 500's daily chart as well.
With 30 minutes to go to the opening bell, Dow Jones futures are up a whopping 2 points.
Current Outlook
From a very short-term perspective, the S&P 500 looks quite bullish and could easily see a breakout above its all-time high close of 2271.72. To get a sense of the bullish behavior, let's look at a 60 minute chart:
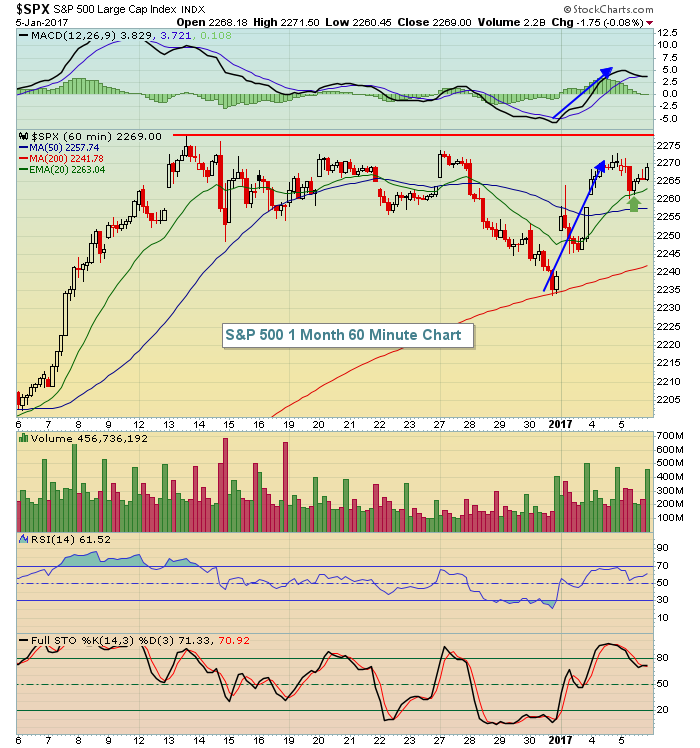 While we finished 2016 on a rather sour note, the bulls have quickly picked up the pieces to begin 2017 and we're clearly in a very short-term uptrend. The successful test of the rising 20 hour EMA with a strengthening MACD certainly provides hope that we'll see a breakout on a closing basis today. We do need to beware, however, of a negative divergence that will form on the daily chart on the S&P 500's if it does make this breakout.
Also, it's important to note that while January is historically bullish until January 19th, the next several days do typically see profit taking. The annualized return on the S&P 500 (since 1950) for the period from January 7th through 13th is -20.41%. That could add additional short-term issues for the stock market next week if a breakout fails.
Sector/Industry Watch
The Dow Jones U.S. Pharmaceuticals Index ($DJUSPR) has been behaving very bullishly since printing a triple bottom in early December. Here is the current technical picture for the group:
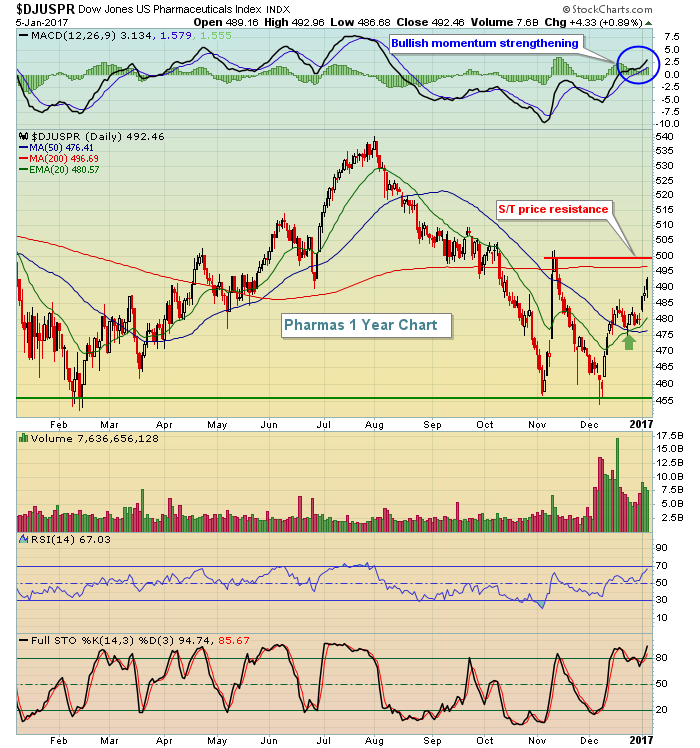 I like the strengthening momentum (MACD) here, along with that very bullish test of the rising 20 day EMA a couple weeks ago. We could see the group struggle at 500 price resistance, however. In the Historical Tendencies section below, it's obvious that healthcare performs well during January, but that's mostly because of relative strength in biotechs ($DJUSBT) and medical equipment ($DJUSAM), not pharmas. The DJUSPR typically underperforms other healthcare areas by a wide margin in January.
Historical Tendencies
Over the last 20 years, healthcare has significantly outperformed the benchmark S&P 500 during the month of January. It's fairly obvious when you highlight the XLV's relative performance on a seasonality chart. Check this out:
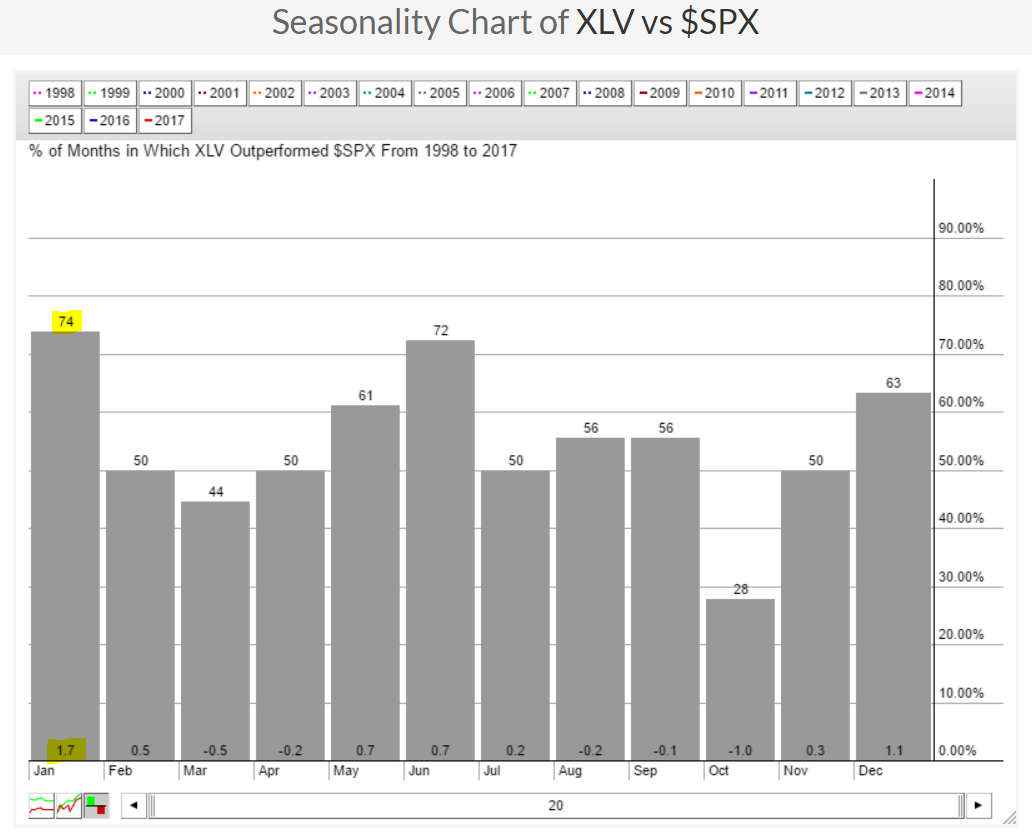 This highlights the fact that the XLV outperforms the S&P 500 during the month of January on average by 1.7%. That's a lot of outperformance. It's by far the best relative performance month for healthcare.
Key Earnings Reports
None
Key Economic Reports
December nonfarm payrolls released at 8:30am EST: 156,000 (actual) vs. 175,000 (estimate)
December private payrolls released at 8:30am EST: 144,000 (actual) vs. 165,000 (estimate)
December unemployment rate released at 8:30am EST: 4.7% (actual) vs. 4.7% (estimate)
December average hourly earnings released at 8:30am EST: +0.4% (actual) vs. +0.3% (estimate)
November factory orders to be released at 10:00am EST: -2.5% (estimate)
Happy trading!
Tom


