Market Recap for Monday, January 30, 2017
It was most definitely a day of profit taking across U.S. equities on Monday. All of our major indices finished lower, although an afternoon rally did cut into some of the earlier losses. Still, the Russell 2000 was hit hardest and finished lower by 1.34% - its second worst daily performance since the rally began in early November. This index of small cap stocks did, however, hold and bounce off price support on its hourly chart. Take a look:
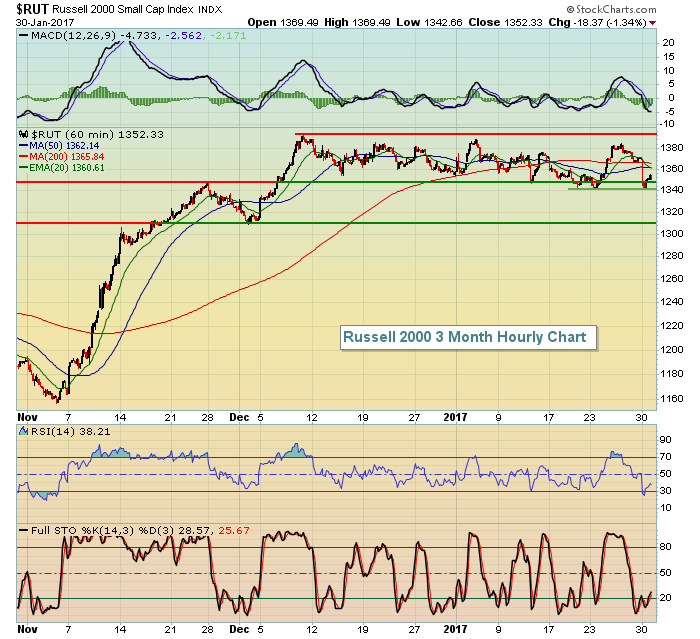 In the very near-term, the double bottom on the Russell 2000 near 1340 is important. If that's lost, a trip down to the 1310-1315 cannot be ruled out, which still would do little damage technically to the long-term technical outlook. To further illustrate, let's look at a weekly chart of the RUT:
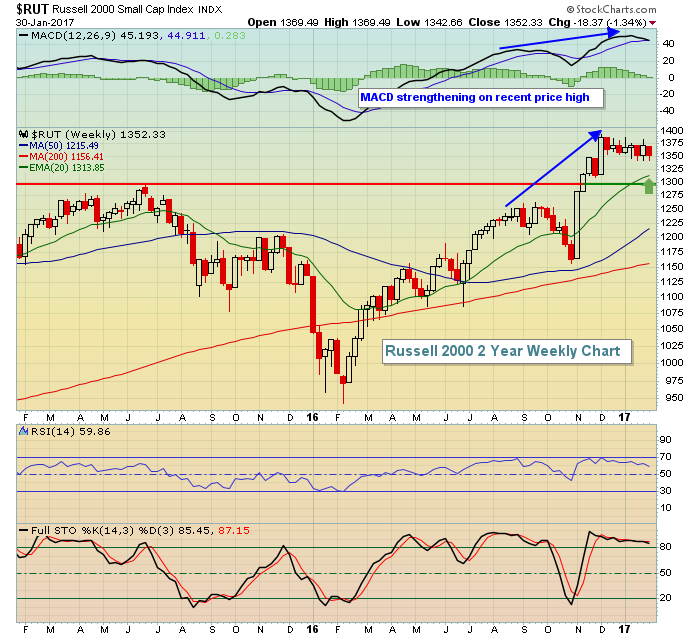 During periods of strengthening momentum, the 20 period EMA tends to provide excellent support. As you can see, that 20 week EMA (green arrow) currently resides at 1314. There's also long-term price support near 1300, resulting from the price breakout that occurred back in early November. So while short-term selling like yesterday's is never fun, there are still several levels of support to protect the current bull market rally.
Defensive stocks like utilities (XLU, +0.08%) and consumer stocks, both staples (XLP, -0.08%) and discretionary (XLY, -0.12%) managed to avoid the carnage on Monday. Otherwise, it was a heavy bout of profit taking.
Pre-Market Action
The Tokyo Nikkei ($NIKK) lost 1.69% overnight, but it appears to be consolidating bullishly above its 20 day EMA for now. Other key Asian markets were mixed overnight. European markets are fractionally higher this morning.
Many prominent companies will be reporting this week, including Apple (AAPL) which reports after the bell tonight. It will be interesting to see if AAPL reports better than expected results as many companies are falling short of expectations this morning.
Dow Jones futures are down 40 points as U.S. equities appear to be primed to continue their selling from Monday - at least at the opening bell. If yesterday's lows are breached, we could see selling accelerate.
Current Outlook
I took a look at the Russell 2000 on different time frames above, so here I'd like to check out the longer-term weekly view of the S&P 500 to identify where a more serious technical breakdown would occur:
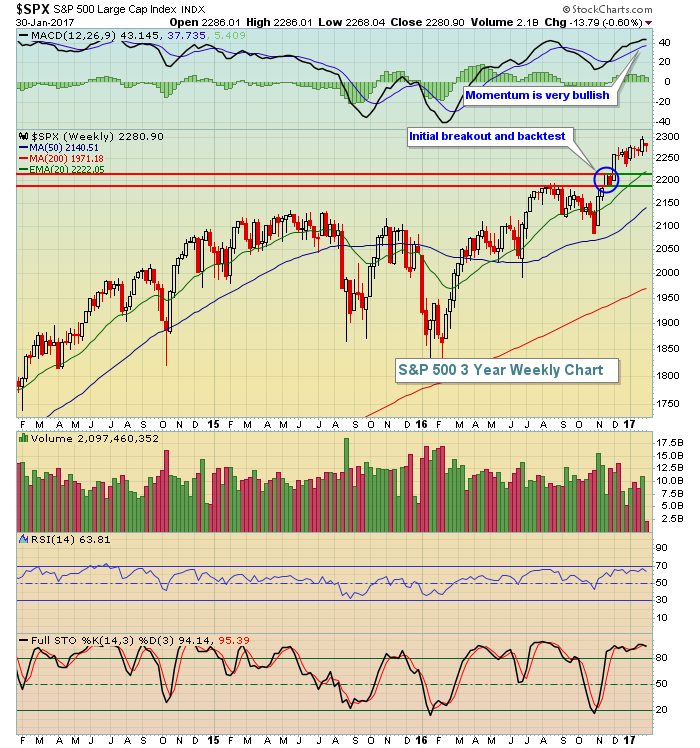 After breaking out above 2190 for the first time in November 2016, we quickly retraced back to that level to test support. Then the next move higher cleared 2215 or so. Given the strong momentum, I expect to see the rising 20 week EMA hold on the S&P 500's weekly chart. Currently, that level resides at 2220, which is also very close to the price support near 2215.
Sector/Industry Watch
Energy (XLE) has been struggling both on an absolute and relative basis over the past several weeks. Yesterday, the XLE hit both price and gap support so it's going to be very interesting to see how the group reacts today. I'd look for a recovery sooner rather than later, but we'll see. Here's the visual:
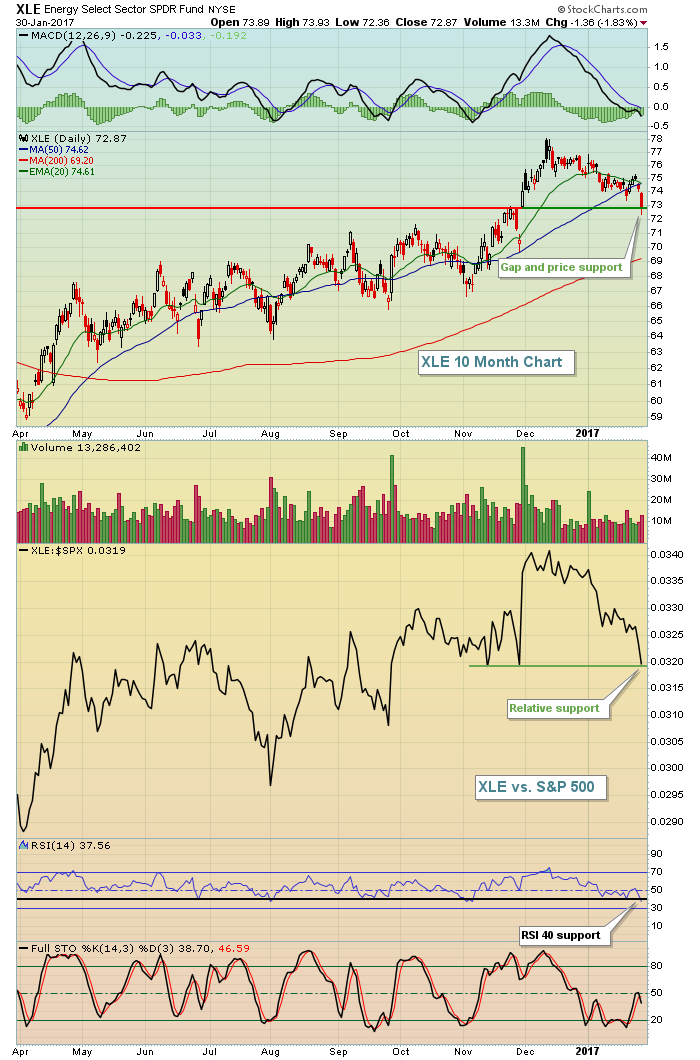 The last price breakout occurred just beneath 73.00 and gap support resides there as well. From the above, you can see that the XLE has returned to the "scene of the crime". Also, the daily RSI has dipped just beneath 40 which has been a critical area of support throughout the XLE's uptrend.
Looking at the relative performance of the XLE vs. the benchmark S&P 500, it's clear that we're at a significant relative support level as well.
Historical Tendencies
History is clearly on the bulls' side the balance of this week. Since 1950 on the S&P 500, here are the annualized returns for each day this week:
January 31 (today): +80.88%
February 1 (Wednesday): +29.36%
February 2 (Thursday): +36.44%
February 3 (Friday): +50.47%
Key Earnings Reports
(actual vs. estimate):
ABC: 1.36 vs 1.24
AET: 1.63 vs 1.45
COH: .75 vs .73
DHR: 1.05 vs 1.03
HOG: .27 vs .31
LLY: .95 vs .99
MA: .86 vs .85
NUE: vs .34 (have not seen actual)
PCAR: .82 vs .87
PFE: .47 vs .50
S: (.12) vs (.08)
SPG: vs 2.51 (have not seen actual)
TMO: 2.41 vs 2.37
UAA: .23 vs .25
UPS: 1.63 vs 1.68
VLO: .81 vs .74
XOM: .90 vs .72
ZMH: vs 2.11
(reports after close, estimate provided):
AAPL: 3.22
AFL: 1.64
AMD: (.04)
APC: (.51)
BXP: 1.50
CB: 2.43
EA: 2.15
EQR: .79
ILMN: .81
Key Economic Reports
November Case Shiller 20-city HPI to be released at 9:00am EST: +0.7% (estimate)
January Chicago PMI to be released at 9:45am EST: 55.3 (estimate)
January consumer confidence to be released at 10:00am EST: 112.2 (estimate)
Happy trading!
Tom


