Market Recap for Friday, February 17, 2017
Consumer staples (XLP, +0.50%) led the market action on Friday as personal products ($DJUSCM) jumped 3.39%. Brewers ($DJUSDB) continued their recent surge and now appear to have clearly broken their downtrend that began in October. Take a look:
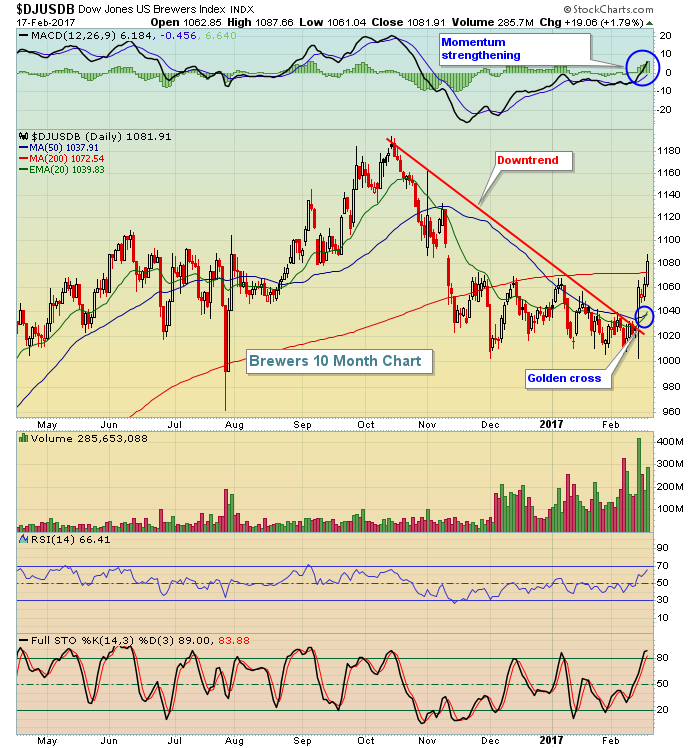 The trendline break is definitely a bullish technical development while the MACD bullish crossover and golden cross (20 day EMA moving above 50 day SMA) confirms that earlier breakout. I would expect that we'll see further strength in this area in the weeks ahead. Not pictured above is the weekly chart where the DJUSDB has cleared its 20 week EMA for the first time in several weeks as well.
There was also strength in technology (XLK, +0.35%) and consumer discretionary (XLY, +0.32%) to help lead our major indices to gains across the board.
Pre-Market Action
A couple of big names beat Wall Street earnings estimates this morning and Dow Jones futures are higher. Wal-Mart (WMT) beat by a penny while Home Depot (HD) posted a huge earnings beat (1.44 vs 1.33). Both companies are trading higher in pre-market action.
Crude oil's ($WTIC) surge this morning is also helping U.S. futures as a holiday-shortened week begins. There is more on crude oil and energy (XLE) in the Sector/Industry Watch section below.
Current Outlook
I remain bullish the U.S. dollar ($USD), but there is a bearish head & shoulders topping pattern in play. It doesn't confirm until neckline support is lost so I don't expect to see it lost. But the pattern is there and we should respect it. Check it out:
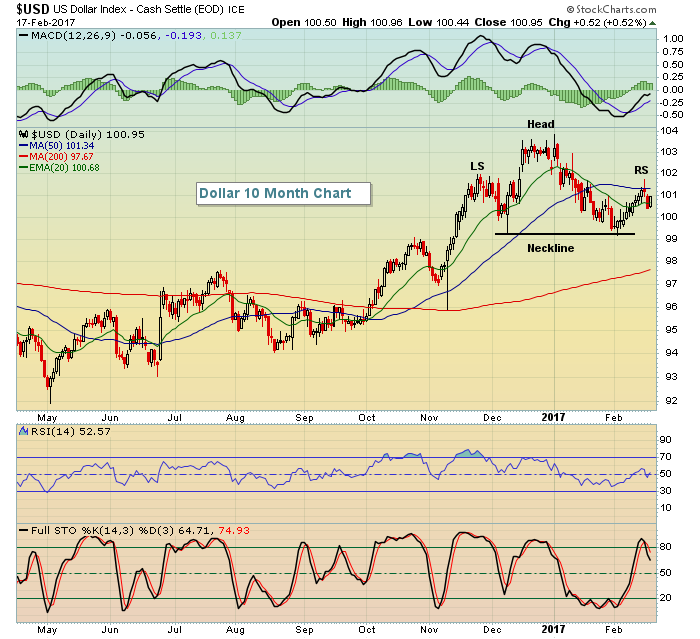 A definitive break below 99 would certainly be a bearish technical development for the dollar and bullish for commodities, especially gold ($GOLD). But again, I'm not expecting a breakdown in the dollar. Instead, a push in the dollar above 102 would begin to argue for a bullish rectangular consolidation pattern with key highs near 104 and lows at 99.
Sector/Industry Watch
Crude oil ($WTIC) has been trading mostly in a fairly narrow $51-$54 per barrel range in 2017. It has held its major breakout level near $51 and that bodes well for the energy sector. In fact, this morning crude oil has spiked 1.6% on news that OPEC is targeting deeper output cuts. This move higher would likely break the 2017 trading range and result in energy shares (XLE) moving higher as well. Let's look at the charts of both the WTIC and the XLE:
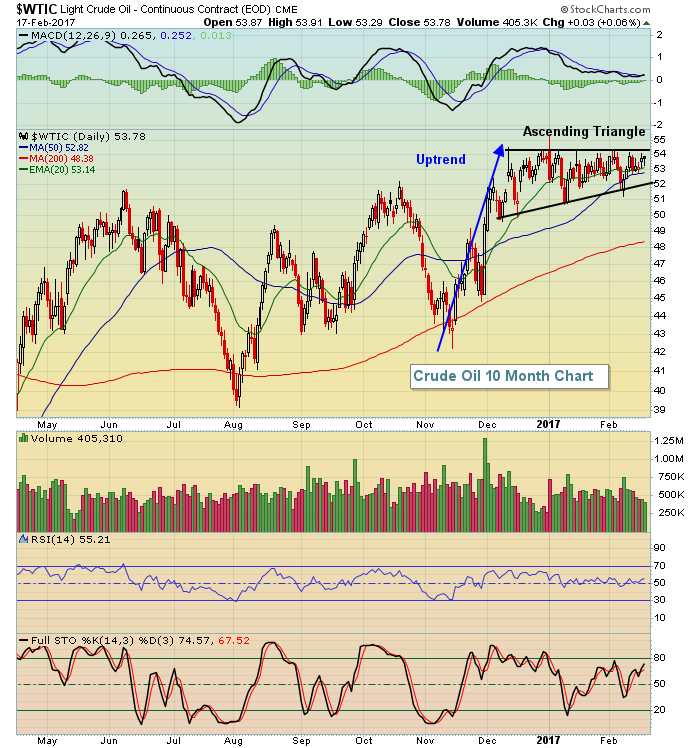 There's a very bullish continuation pattern on the WTIC and this morning's push above $54 could be the breakout with OPEC once again the catalyst. Let's see how crude oil trades over the balance of the day, but I suspect we'll begin to see outperformance in the XLE as it's just hit very key moving average support on its weekly chart:
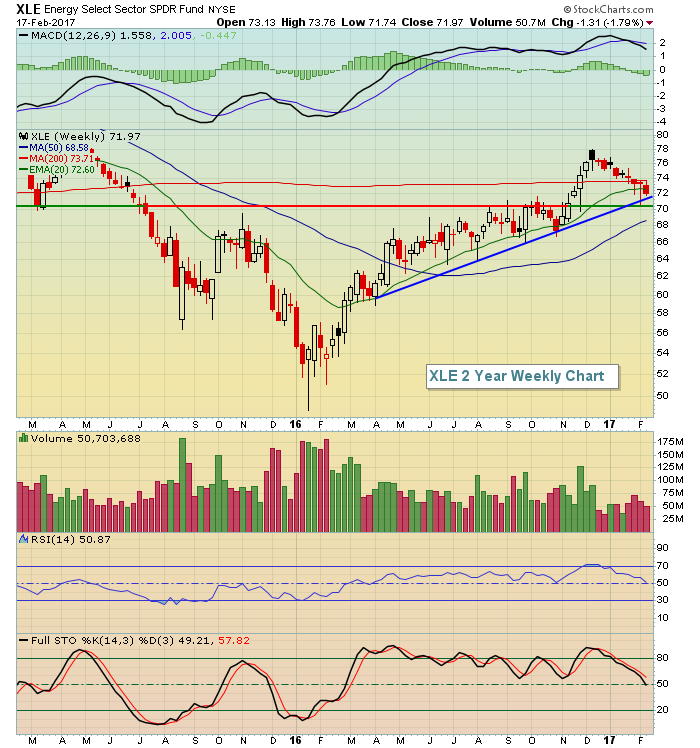 The XLE did close just beneath its rising 20 week EMA support, but that happened briefly once before in October and we've seen multiple intraweek moves beneath that moving average. Given the key price and trendline support in the 70-71 area, the XLE is in a very solid reward to risk area as a close below 70 could represent a stop with an insignificant loss.
Historical Tendencies
Momentum is beginning to build on Ulta Beauty's (ULTA) weekly chart and the right side of a cup appears to have almost formed. ULTA also just so happens to be the best performing stock in the NASDAQ 100 during the month of March - averaging 10.4% during this upcoming month over the past 11 years. It's also averaged gaining 5.1%, 3.2% and 5.0% during the months of April, May and June, respectively. A technical breakout would be accompanied by very bullish seasonal strength so ULTA is a stock to watch.
Key Earnings Reports
(actual vs. estimate):
AAP: 1.00 vs 1.09
AER: 2.18 vs 1.70
AGR: .67 vs .63
HD: 1.44 vs 1.33
M: 2.02 vs 1.97
MDT: 1.12 vs 1.11
SNI: 1.02 vs 1.05
WMT: 1.30 vs 1.29
(reports after close, estimate provided):
CXO: (.09)
EIX: .95
FE: .39
FSLR: .97
NEM: .39
VRSK: .77
Key Economic Reports
None
Happy trading!
Tom


