Market Recap for Tuesday, February 21, 2017
Our major indices saw another solid day of gains with the Dow Jones, S&P 500, NASDAQ, NASDAQ 100 and Russell 2000 all breaking out to all-time highs once again. All nine sectors advanced and small caps led on a relative basis. But that's about where the positive "beneath the surface" signals ended. I've detailed some warning signs below in both the Current Outlook and Sector/Industry Watch sections. I'm not bearish, but action that's developed over the past few weeks needs to be monitored closely as we move through the next few weeks.
Utilities (XLU, +1.05%) and consumer staples (XLP, +0.90%) led the action and that defensive leadership has become a bit more prevalent recently. Energy (XLE, +0.68%) also showed relative strength and that has not been happening much lately. But with crude oil ($WTIC) closing at a fresh new high, energy stocks drew some attention. I'd expect to see follow through, but crude oil and energy stocks tend to be quite volatile.
Pre-Market Action
U.S. futures are relatively flat this morning with the S&P futures down a couple points 30 minutes from the opening bell. Overnight, the Hang Seng ($HSI) surged past its previous high close of 24099, finishing at 24202. In Europe this morning, the German DAX ($DAX) is following up on Tuesday's breakout with small gains of 12 points, creeping closer and closer to 12390.75, its all-time high set in 2015.
Current Outlook
Ok, I know that headline today is perhaps a bit scary, but I'm not really worried at this point. It's like driving down the highway and approaching the intersection where the traffic light has just turned from green to yellow. It's not red yet, so drive right through. Slamming on your brakes would likely be more dangerous than driving through. That's how I'd view the recent action in the stock market. The light has just begun to turn yellow. The difference with my analogy is that I believe the stock market traffic light will turn back to green.
But time will tell.
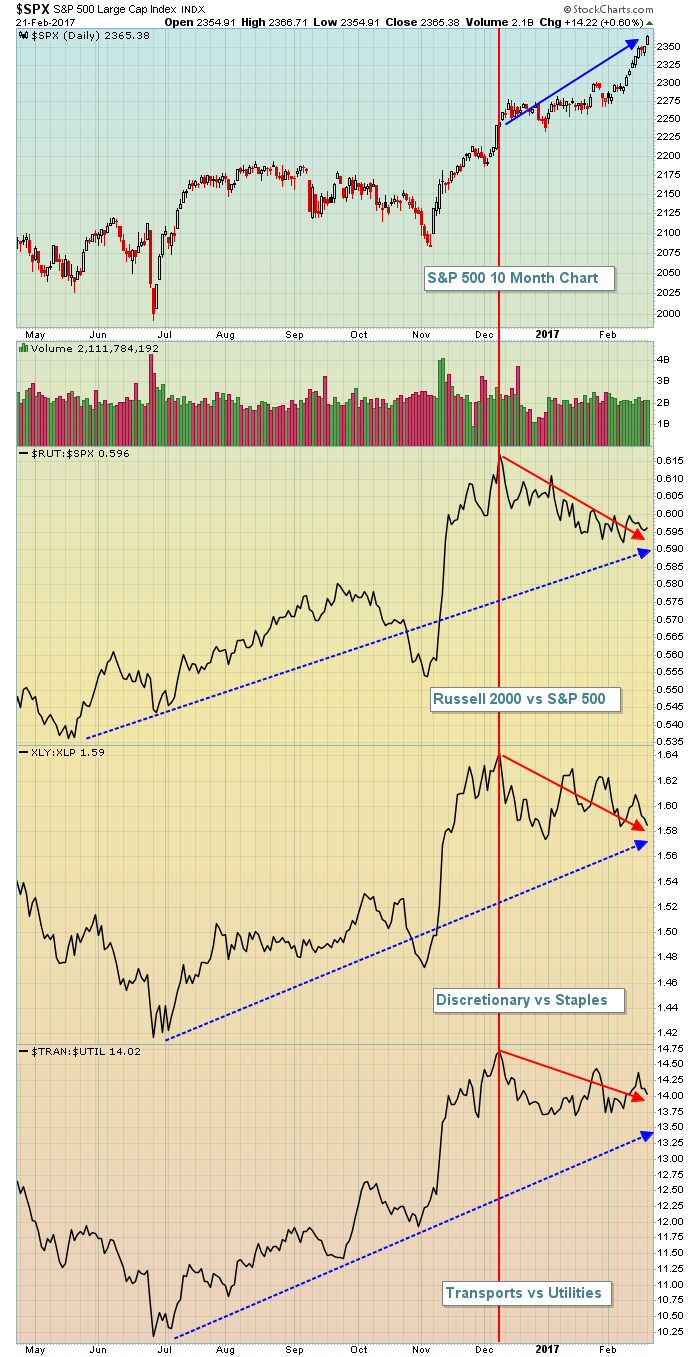
The very short-term concern for me is that the S&P 500 continues pushing higher while key relative ratios have failed to break out. Take a look at the chart below:
 The good news is that the longer-term uptrend in riskier areas remains in place and that the S&P 500, along with our other major indices, keeps setting record new highs with strong momentum in place. Also, we want to see wide participation during market advances and we're still seeing that. While the relative ratios have turned lower over the past couple months, the absolute returns in areas like small caps, consumer discretionary and transportation are positive. They're not going down, they just aren't keeping up on a relative basis and that could - and should - soon begin to change.
Still, the caution light is now on as we travel through a key stock market intersection and we need to be alert
Sector/Industry Watch
The four top sector SCTRs right now belong to:
Financials (XLF): 97.9
Technology (XLK): 90.1
Industrials (XLI): 89.6
Consumer Discretionary (XLY): 63.2
The lowest sector SCTRs belong to energy (XLE) and the three defensive sectors - utilities, consumer staples and healthcare. So that "big picture" performance certainly supports the current bull market.
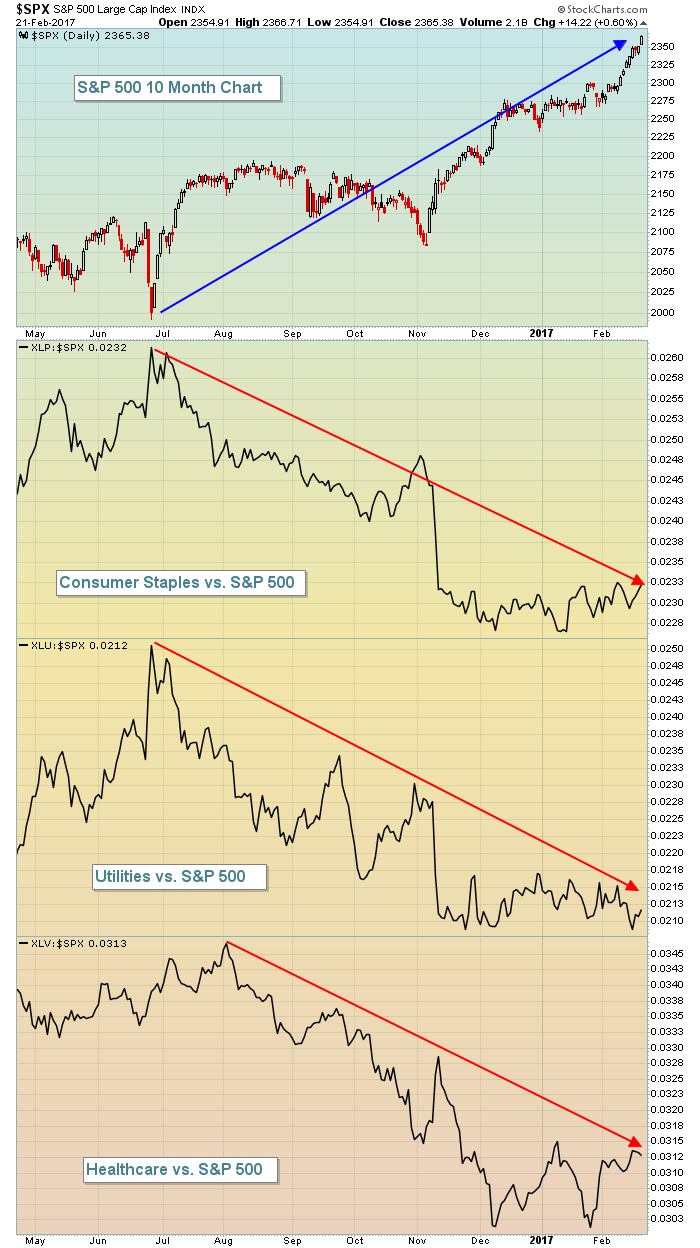
But the short-term has changed considerably with the S&P 500's gains over the past week led by consumer staples (XLP, +2.46%), utilities (XLU, +1.87%) and healthcare (XLV, +1.54%). One week doesn't make a long-term trend, but this past week's performance should at least put us on alert to see if this condition begins to change and traders resume their appetite for riskier areas of the market. Despite the recent surge in defensive sectors, these three sectors look awful relative to the S&P 500 over the past 10 months:
 From a bullish perspective, we want to see the S&P 500 breaking out on an absolute basis and the defensive sectors breaking to fresh relative lows vs. the S&P 500. For now, those ratios are holding relative support.
Historical Tendencies
I had recently posted that the February 16-22 period has been historically bearish for the S&P 500. That seasonal weakness extends to February 23rd on the NASDAQ. But thus far, those historical headwinds have done little to slow this bull market. And there's only one more day left of it on the S&P 500 and two days on the NASDAQ. With futures this morning again pointing to gains, it looks as if the bears cannot change the bullish environment - even during a period of historical weakness.
While February tends to end with a period of consolidation and perhaps a touch of bearish historical tendencies, early March is most definitely bullish with the following S&P 500 annualized returns by calendar day since 1950:
March 1: +79.77%
March 2: +10.69%
March 3: +28.71%
March 4: +47.76%
March 5: +29.00%
Key Earnings Reports
(actual vs. estimate):
DISH: .70 vs .66
GRMN: .73 vs .58
HCN: 1.10 vs 1.08
HST: .41 vs .38
LAMR: 1.32 vs 1.21
MBLY: .14 vs .12
NCLH: .48 vs .56
SO: .24 vs .31
TJX: vs. 1.00 (awaiting actual numbers)
TOL: .42 vs .35
UTHR: 2.64 vs 3.62
(reports after close, estimate provided):
CLR: (.12)
CTRP: .00
ETP: .20
HPQ: .37
LB: 1.90
O: .75
PSA: 2.63
RIG: .04
SINA: .27
TS: .04
TSLA: (1.19)
TV: .24
Key Economic Reports
January existing home sales to be released at 10:00am EST: 5,580,000 (estimate)
Happy trading!
Tom


