Market Recap for Thursday, February 2, 2017
Defensive stocks were once again at the forefront of U.S. stock market action on Thursday with utilities (XLU, +1.06%) and consumer staples (XLP, +0.92%) easily the best two sectors on the session. Over the past week, healthcare (XLV, +2.79%), utilities (XLU, +0.91%) and consumer staples (XLP, -0.02%) have been the three best performing sectors. There have been a few reasons for it. First, the U.S. stock market is in consolidation mode with the benchmark S&P 500 index down close to 1% from a week ago. Second, the 10 year treasury yield ($TNX) has been declining over the past week and that's generally a reason for investors to rotate into the high-yielding, defensive utilities sector. Finally, the steady decline in the U.S. Dollar ($USD) in 2017 has driven more traders toward gold ($GOLD).
It's not at all unusual, however, to see money flow toward defense when prior gains are being consolidated. Pharmaceuticals ($DJUSPR) are a perfect example of this short-term rotation. The DJUSPR is not a particularly healthy group but as profit taking has occurred in other more aggressive areas, that money hasn't really left the market. Instead, we see it finding areas that are at or approaching key support and haven't participated in the advance. Check out the DJUSPR:
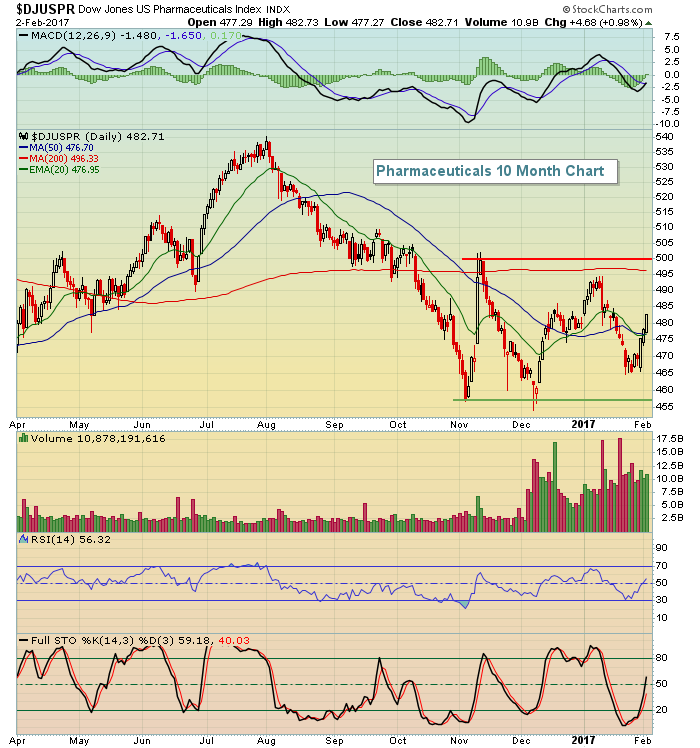 The good news for the bulls is that when selling kicks in, our major indices show little in the way of decline because of areas like the DJUSPR. Money rotates here. The problem is that these groups are not technically sound and shouldn't be relied upon to drive the S&P 500 to new highs. The trading range on the DJUSPR is from the 455 area to near 500. I'd look for money to rotate back away from areas like pharmas when the next breakout in our major indices occur.
Pre-Market Action
Crude oil ($WTIC) is higher by approximately 0.50% this morning and U.S. futures are pointing to a higher open as well. The government's nonfarm payrolls report was released a half hour ago and jobs came in well above estimates - 227,000 vs. the expected 175,000. Surprisingly, the TNX has not moved higher. That will be interesting to watch as the day moves on.
Current Outlook
The Dow Jones Transportation Average ($TRAN) has pulled back over the past week after challenging a breakout. Now it's back to a level where it's threatening short-term support. Here's a look at the current technical picture:
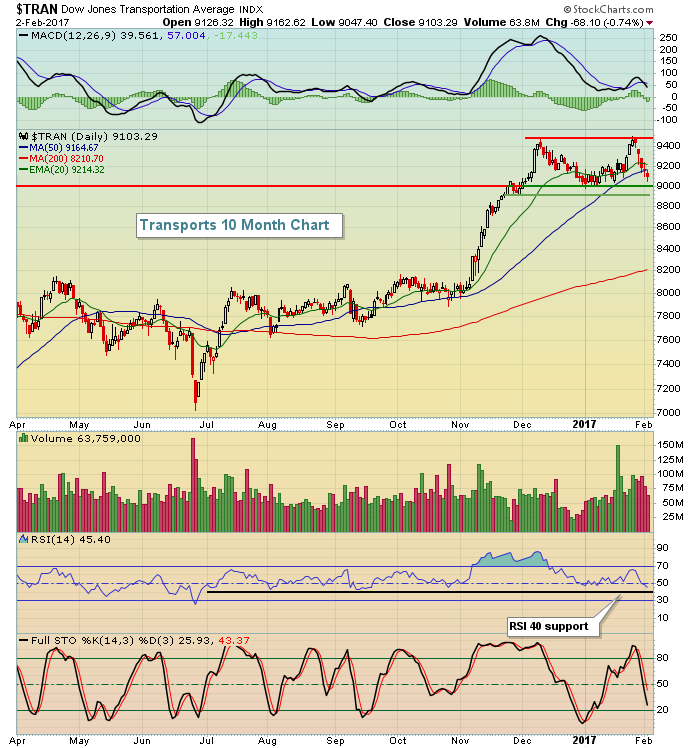 I'll be surprised if price support from 8900-9000 is lost as airlines ($DJUSAR), railroads ($DJUSRR) and truckers ($DJUSTK) all have very solid technical patterns in play.
Sector/Industry Watch
The Dow Jones U.S. Toys Index ($DJUSTY) ran into weekly momentum issues over the summer of 2016 and needed an unwinding before setting up for another advance. The entire process looks very similar to what the group experienced in late 2015, just prior to another period of selling and consolidation. Check this out:
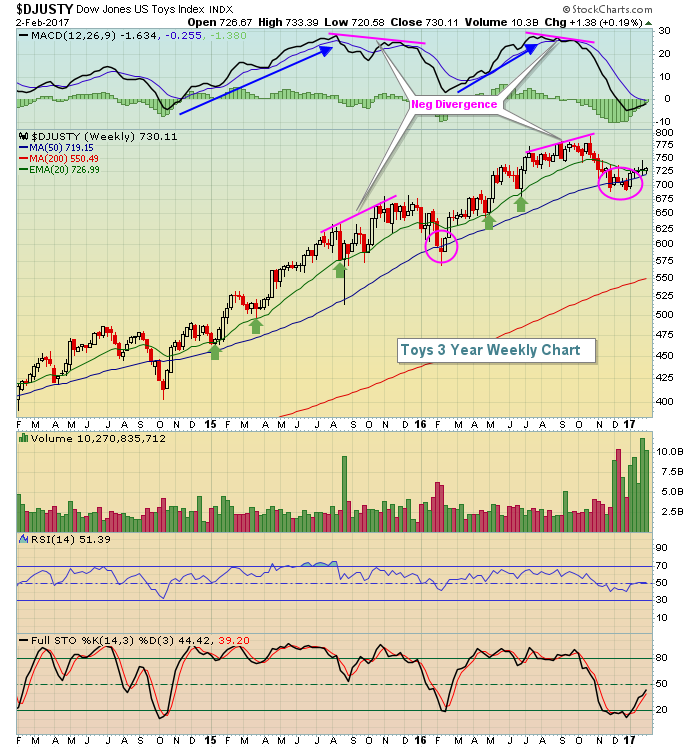 In a nutshell, this is exactly how I use the MACD and moving averages to determine likely directional moves. Note that while the weekly MACDs are rising (blue directional lines), pullbacks are typically contained by the rising 20 week EMAs. But once new price highs are established without corresponding highs in the MACD, the index is set up for additional selling down to rising 50 week SMAs and MACD centerline tests. The latest momentum issue has been resolved and the DJUSTY now appears poised to resume its prior uptrend.
Historical Tendencies
While the technical picture of the DJUSTY has improved dramatically in recent weeks, the historical picture is very bullish as well. Take a look at how toys perform seasonally:
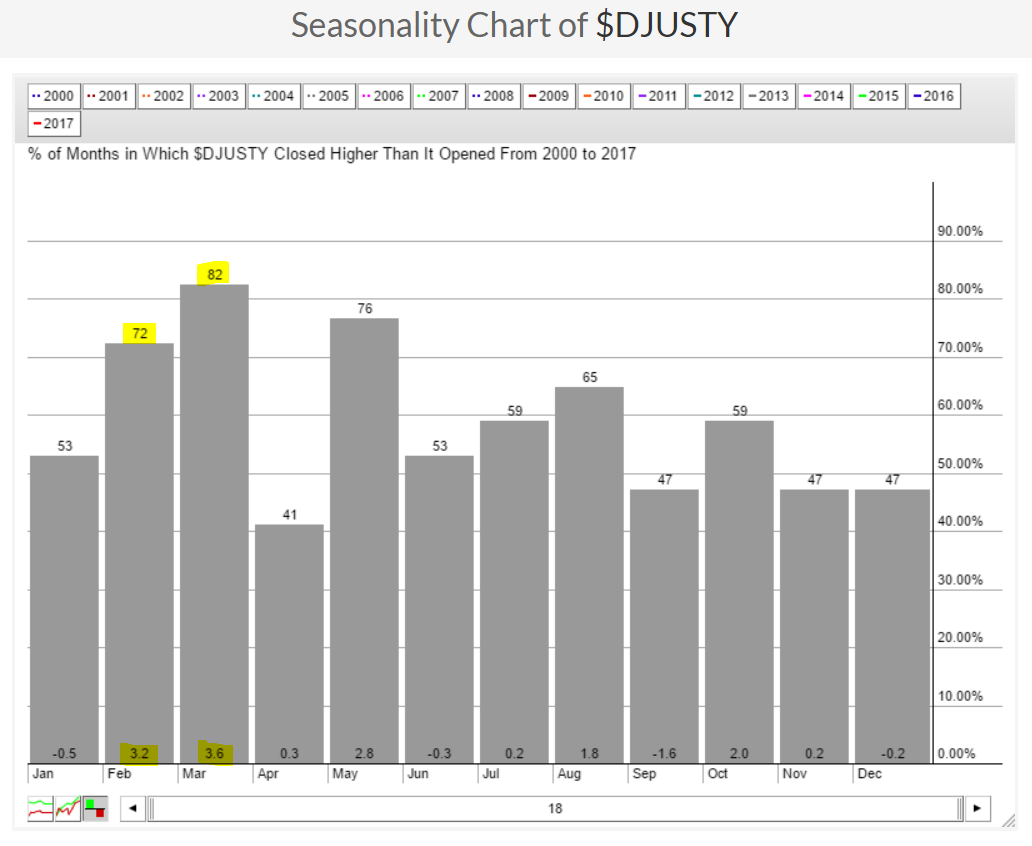 February and March represent the two best consecutive calendar months throughout the year. You might want to put a toy in your portfolio. :-)
Key Earnings Reports
(actual vs. estimate):
AN: .95 vs .96
BERY: .50 vs .45
CLX: 1.25 vs 1.22
HMC: .80 vs .49
HSY: 1.17 vs 1.08
LYB: 2.18 vs 2.11
PSX: .16 vs .39
WY: .14 vs .15
Key Economic Reports
January nonfarm payrolls released at 8:30am EST: 227,000 (actual) vs. 175,000 (estimate)
January unemployment rate released at 8:30am EST: 4.8% (actual) vs. 4.7% (estimate)
January private payrolls released at 8:30am EST: 237,000 (actual) vs. 180,000 (estimate)
January average hourly earnings released at 8:30am EST: +0.1% (actual) vs. +0.3% (estimate)
December factory orders to be released at 10:00am EST: +0.9% (estimate)
January ISM non-manufacturing index to be released at 10:00am EST: 57.0 (estimate)
Happy trading!
Tom


