Market Recap for Wednesday, February 1, 2017
U.S. equities staged a recovery on Wednesday after a recent bout of profit taking, but the recovery could've been much stronger after a very solid open. The NASDAQ jumped 40 points at the open after Apple (AAPL) posted results well in excess of Wall Street consensus estimates. Unfortunately, most of those opening gains were gone by noon EST before an afternoon rally secured the strong performance by technology (XLK, +0.76%). Still, much of the strength was seen in computer hardware, semiconductor and internet shares. Six of the eleven industry groups in technology finished lower on the session so it clearly was not a day of wide participation.
Healthcare (XLV, +0.87%) bested all sector performance on Wednesday as this defensive group rose on the heels of very strong performers within the health care providers and medical supplies industry groups. The XLV has much more work to do, however, as you can see from the absolute and relative charts below:
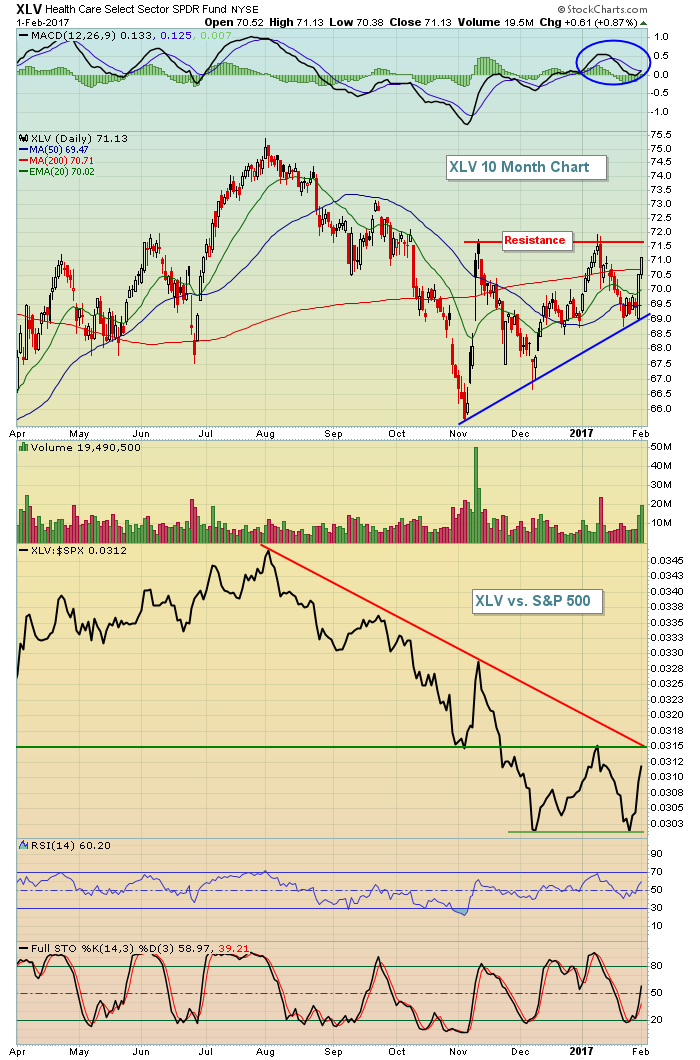 It's hard to get on board healthcare stocks until we see that relative downtrend line break, along with an absolute breakout on the XLV above 71.50-72.00 price resistance. The MACD has been above the zero line for the past month after spending the previous four months below that line - so we've seen improvement in terms of bullish momentum. But the XLV needs to finish off this strength with absolute and relative breakouts.
Pre-Market Action
The 10 year treasury yield ($TNX) is retreating back to 2.44% in early trading today after the Fed provided little in the way of a directional signal on rates in 2017. That, in turn, has weakened the U.S. Dollar index ($USD) after it closed yesterday in its key 99-100 support range. A weakening dollar is great news for gold ($GOLD) and gold is climbing significantly this morning - to 1226 at last check, above key price and moving average resistance in its long-term downtrend.
The Tokyo Nikkei ($NIKK) was weak overnight, dropping 1.22% and there's more of a mixed picture in Europe this morning. Dow Jones futures are down 61 points as we approach a new trading session.
Current Outlook
The S&P 500 recently broke out above 2280 but it's stumbled a bit since with that negative divergence still present on its daily chart. The big picture weekly chart remains very bullish so I'm not looking for a big selloff in the near-term. However, a trip back to the rising 50 day SMA cannot be ruled out and that 50 day SMA is just above short-term price support that currently rests near 2240. Here's a visual of the current trading range to watch given the momentum issues:
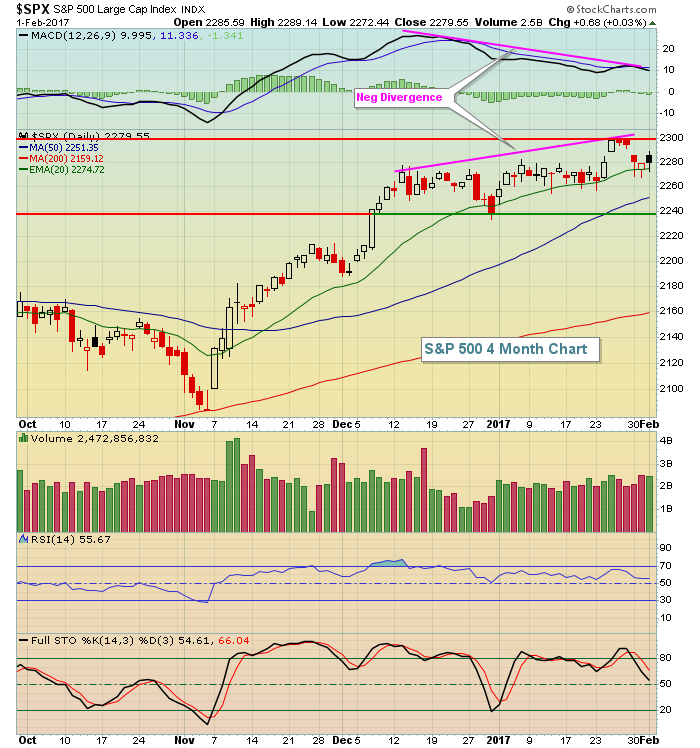 For now, I'll call the trading range 2240-2300. Should we fail to clear 2300 resistance this week, we'll likely head into a period of profit taking next week that could lead to a test of short-term price support closer to 2240. I've highlighted a seasonal tendency based on the calendar in the Historical Tendencies section below.
Sector/Industry Watch
I discussed above the difficulties that the healthcare faces in the near-term attempting to become a relative outperformer. The Dow Jones U.S. Health Care Providers Index ($DJUSHP) is doing all it can to help foster that reversal as the industry group broke out above key price resistance yesterday. Check it out:
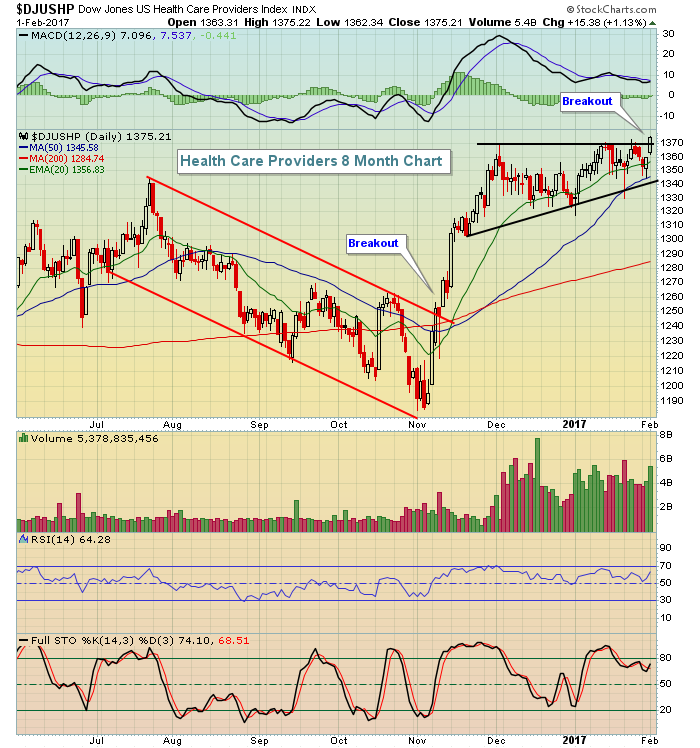 The first step to this group becoming healthy was the down channel breakout in November. Since that time, the DJUSHP has been on fire with a recent bullish ascending triangle forming to consolidate the prior gains. Wednesday's breakout above that triangle resistance was accompanied by increasing volume and this suggests to me that we'll likely see continuing strong performance in this space for weeks to come. Continuing strength here is healthcare's best chance to regain its relative strength among sectors.
Historical Tendencies
As I mentioned yesterday, money flows tend to send equity prices higher early in calendar months. That leads to profit taking from the 7th through 10th of calendar months. If we combine the results of every 7th to 10th period in every calendar month since 1950 on the S&P 500, we find that the annualized performance is -5.97%, nearly 15 percentage points beneath the S&P 500's long-term average annual gain of approximately 9%. While this "only" represents a four day period within a calendar month, keep in mind it's every month for 67 years. This totals more than 2200 trading days or roughly 9 years worth of data. In my opinion, this clearly is a representative sample to draw conclusions from. Tuesday is February 7th so keep that in mind if we're testing the upper end of our current 2240-2300 trading range on the S&P 500 come Monday.
Key Earnings Reports
(actual vs. estimate):
ALV: 1.71 vs 1.83
AZN: 1.21 vs .51
BCE: .57 vs .59
BDX: 2.33 vs 2.11
BLL: .87 vs .86
BSX: .30 vs .29
CI: 1.87 vs 1.74
CME: 1.14 vs 1.10
COP: (.26) vs (.38)
EL: 1.22 vs 1.16
EQT: .25 vs (.11)
ETN: 1.12 vs 1.10
HRS: 1.42 vs 1.37
IP: .73 vs .70
MMC: .89 vs .84
MRK: .89 vs .88
NOK: .13 vs .08
NVO: .50 vs .52
PH: 1.91 vs 1.40
PM: 1.10 vs 1.11
RDS.A: .44 vs .72
SIRI: .04 vs .04
XEL: .45 vs .44
(reports after close, estimate provided):
AMGN: 2.77
AMX: (.04)
AMZN: 1.40
HIG: .96
V: .78
Key Economic Reports
Initial jobless claims released at 8:30am EST: 246,000 (actual) vs. 253,000 (estimate)
Q4 productivity released at 8:30am EST: +1.3% (actual) vs. +1.2% (estimate)
Happy trading!
Tom


