Market Recap for Monday, February 27, 2017
Energy (XLE, +0.86%) led the market advance on Monday and that hasn't happened much over the past few months. But as I have shown below in the Sector/Industry Watch section, I believe there are several technical signs that we could have witnessed (or be in the process of witnessing) a very significant bottom being set. The XLE is also the best performing sector ETF during the calendar months of March and April over the past two decades. Tomorrow marks the beginning of March so we'll soon find out whether historical trends begin to kick in.
Financials (XLF, +0.53%) and healthcare (XLV, +0.48%) also performed very well on Monday. The latter was buoyed by a very strong biotech industry ($DJUSBT), which gained nearly 2% on the session. That was just the beginning, though, as the DJUSBT made a breakout to a level not seen over the past five months. That's significant and could jumpstart this very aggressive and volatile industry group. Check this out:
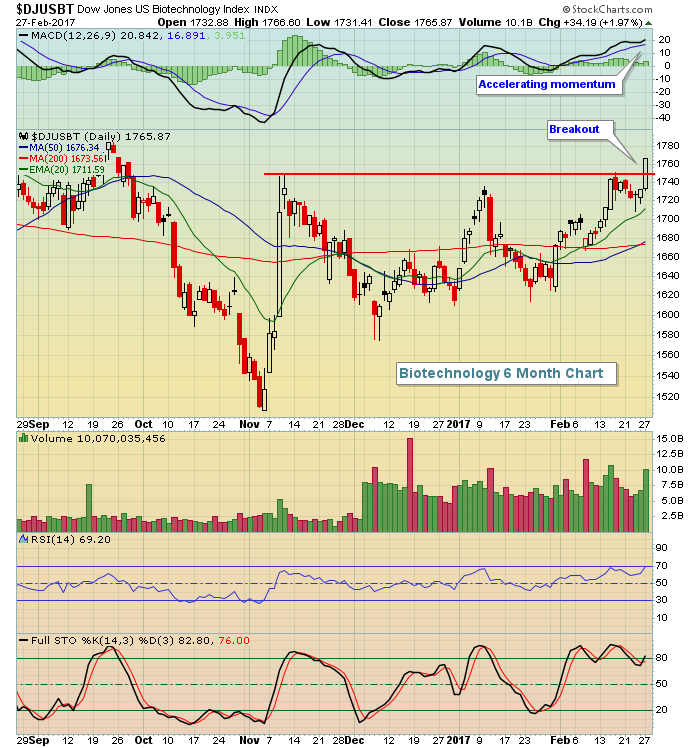 On the DJUSBT weekly chart (not shown), biotechs have now moved considerably above their now rising 20 week EMA, which is currently at 1686. That's the level to the downside I'd watch. Otherwise, I expect to see further strength from biotech stocks in the days and weeks ahead.
Pre-Market Action
priceline.com (PCLN) is poised to make another breakout this morning after reporting exceptionally strong revenues, earnings, and bookings after the bell on Monday. But.....Target (TGT) reported very disappointing results this morning, coming up well short of Wall Street consensus estimates. So is the glass half full or half empty. Apparently, the U.S. market can't make up its collective mind as Dow Jones futures are down 7 points as we head into another trading day. If traders here are looking to global markets for a clue, they may want to look elsewhere. Asia was mixed overnight and Europe's key markets are flat this morning.
One day after showing relative strength, crude oil ($WTIC) is down 0.8% this morning. The 10 year treasury yield ($TNX) bounced solidly on Monday, but is down slightly this morning.
Current Outlook
I like to see outperformance by the Russell 2000 as U.S. indices move to fresh highs. Unfortunately, we've been witnessing the opposite over the past three months. Small caps relative to the S&P 500 have been declining. That's the bad news. The good news, however, is that the recent underperformance has taken the shape of a relative bull wedge and a breakout would begin to suggest more bullishness ahead. Technically, the price action on the Russell 2000 has turned bullish again after months of price consolidation. Check it out:
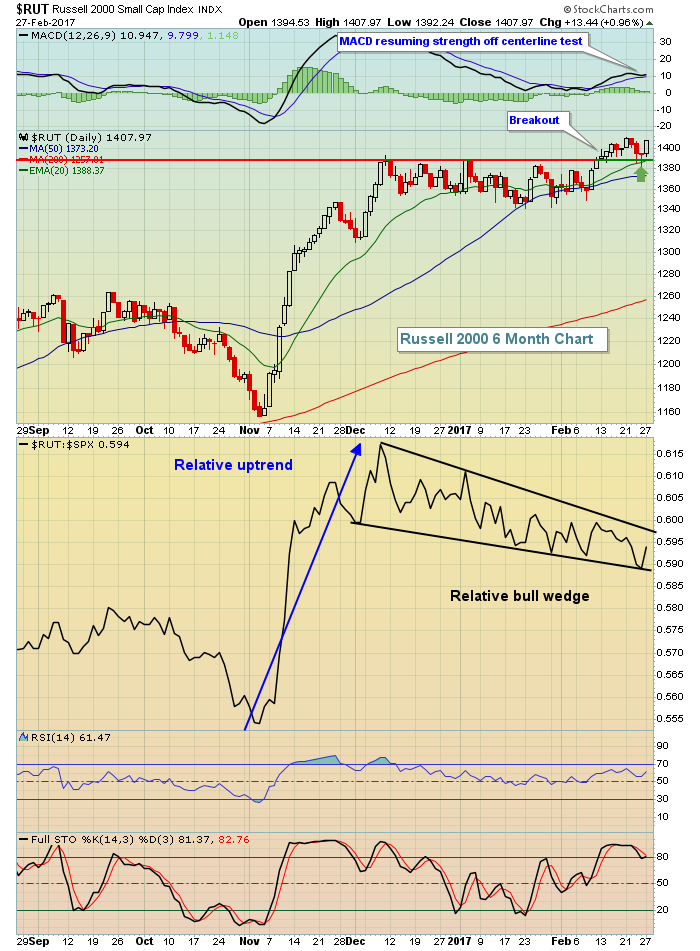 Just a couple weeks ago, we saw the Russell 2000 break out to fresh all-time highs. This comes on the heels of a basing consolidation period and that's a bullish technical development. Also bullish was the recent pullback to test the rising 20 day EMA successfully. So everything is in place for a sustained move to the upside - except that we need to see the breakout on a relative basis. Keep an eye on that.
Sector/Industry Watch
Have we marked a bottom on energy (XLE) with the recent double bottom at gap support? Apparently some think so as energy led the market advance on Monday with volume picking up quite significantly in the ETF. Here's a quick glance at the recent downtrend and that potential double bottom:
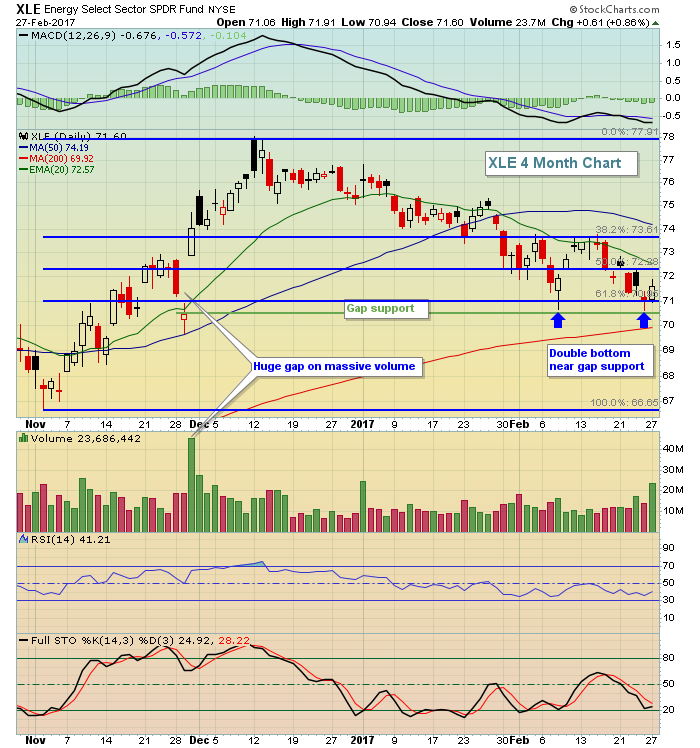 In addition to the double bottom and gap support, a critical Fibonacci support level (61.8% retracement) also supports a turn back to the upside in energy.
(Disclosure: I own XLE)
Historical Tendencies
I wrote an article on January 7th detailing relative performance (vs. the benchmark S&P 500) of sectors by calendar month throughout the year. The spreadsheet that I provided in that article highlighted the relative strength by color coding each month's relative performance. If you haven't seen that article, I believe it's worth at least noting times of the year when certain sectors perform well.....and of course when they don't. Energy (XLE), financials (XLF) and industrials (XLI) perform exceptionally well during March and April. Simply click the article link below to review this information:
Summary Of Sector Relative Strength By Calendar Month
Key Earnings Reports
(actual vs. estimate):
BMO: 1.71 vs 1.38
DPZ: 1.48 vs 1.42
EXPD: .61 vs .59
TGT: 1.45 vs 1.50
(reports after close, estimate provided):
AMBA: .50
CRM: .04
PANW: (.38)
ROST: .75
UHS: 1.80
VEEV: .11
VRX: 1.24
Key Economic Reports
Q4 GDP (2nd estimate) released at 8:30am EST: +1.9% (actual) vs. +2.1% (estimate)
December Case Shiller HPI to be released at 9:00am EST: +0.7% (estimate)
February Chicago PMI to be released at 9:45am EST: 53.0 (estimate)
February consumer confidence to be released at 10:00am EST: 111.3 (estimate)
Happy trading!
Tom


