Market Recap for Tuesday, February 28, 2017
It was a day of profit taking on Tuesday. All of our major indices declined, although the selling was certainly contained. The S&P 500, for instance, dropped just 0.26% and remains near its all-time high. Weakness in consumer discretionary (XLY, -0.75%), technology (XLK, -0.48%) and industrials (XLI, -0.41%) led to a much steeper drop in the more aggressive NASDAQ (-0.62%) and especially the small cap Russell 2000 (-1.51%). The XLY, XLK and XLI are all very overbought on their respective weekly charts so a period of weakness would not be too alarming. The fall in small cap shares is a bit more concerning, however, as yesterday's close of 1386 was slightly below its 20 day EMA, currently at 1388. Furthermore, the Russell 2000 is the only major U.S. index that currently is reflecting a negative divergence on its weekly chart. Check it out:
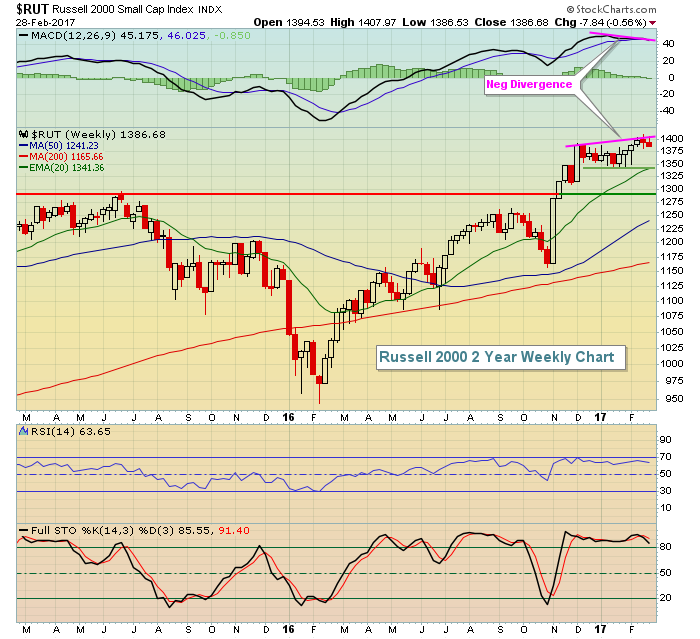 Granted, the negative divergence is slight so there's certainly an opportunity for small caps to breakout again and eventually eliminate that negative divergence. But I've marked a key price support level (green horizontal line) that coincides with the rising 20 day EMA, currently at 1341.
Pre-Market Action
The beige book will be released this afternoon. It's released generally two weeks before FOMC monetary policy meetings and the information in this report helps to direct the Fed's interest rate policy. So many market participants will be analyzing the data this afternoon to predict whether the Fed will again move to raise rates in mid-March.
The Tokyo Nikkei ($NIKK) rose 275 points, or 1.44%, overnight and European stocks are very strong this morning with the German DAX ($DAX) rising 186 points at last check to clear 12000. Its all-time high of 12390 is getting closer and closer and the positive correlation between German stocks and the S&P 500 is quite clear so a breakout in the DAX should be viewed bullishly here in the U.S.
Dow Jones futures are set to open quite bullishly today as they're higher by 157 points just 30 minutes before the opening bell. It's also important to note that the 1st calendar day of the all calendar months combined is by far the best calendar day of the month, rising at an annualized rate of 46.17%. The reason? Money flows.
Current Outlook
The 10 year treasury yield ($TNX) is surging higher this morning - up 9 basis points at last check to 2.44%. Higher yields tend to lift financial stocks and the banking industry ($DJUSBK) is typically a major beneficiary. Banks have been consolidating for the past several trading sessions since breaking out above the 410 level. Here's a current outlook on banks:
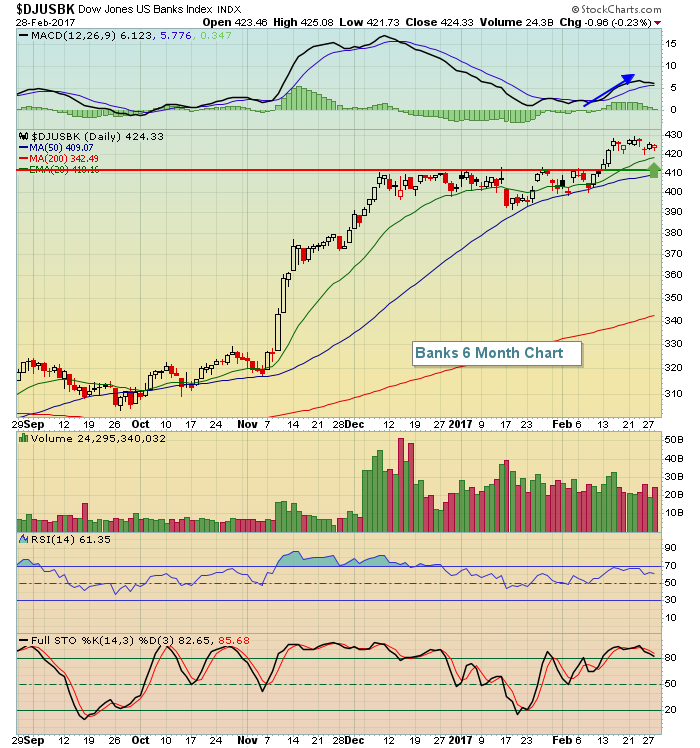 Note that the daily MACD retraced back nearly to its centerline support, but has since resumed its move to the upside - a signal of accelerating momentum. Therefore, I'd consider the rising 20 day EMA as a potential entry point into bank stocks, while price support closer to 410 would be the next. Below in the Historical Tendencies section I highlight the historical strength of banks from March through May.
Sector/Industry Watch
The recent move into utilities (XLU) has resulted in a multi-month relative breakout (vs. the benchmark S&P 500) that bears watching. Utilities represent defensive stocks and those stocks should not lead a bull market for very long. Take a look at the recent strength:
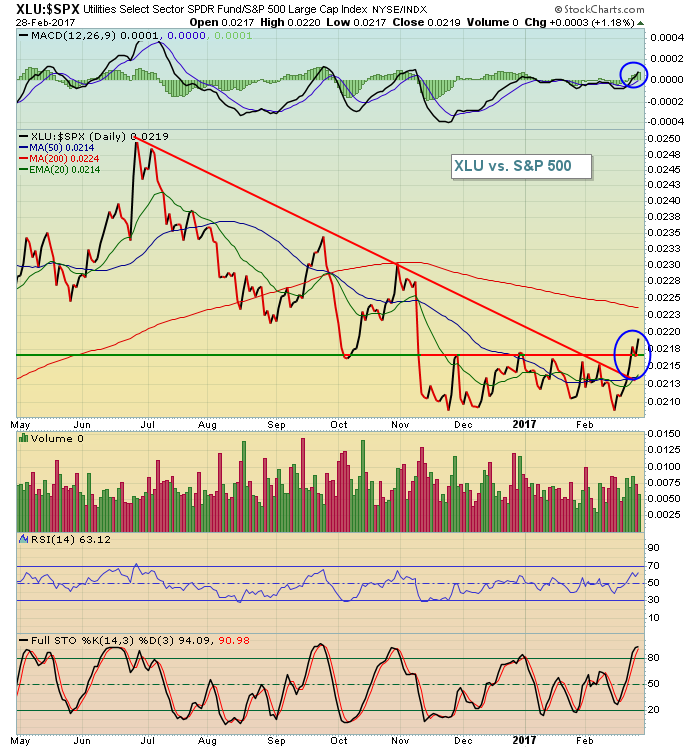 This is the highest relative level of the XLU:$SPX since early November, when this significant bull market rally began. Money has clearly rotated toward utilities and if the bull market is to continue long-term, we need to see this relative strength take another turn to the downside.
Historical Tendencies
Banks tend to perform very well from March through May as its average gains are stronger during this upcoming three month calendar period than any other three month period during the year. Here is a seasonality chart to highlight the historical outperformance that begins today:
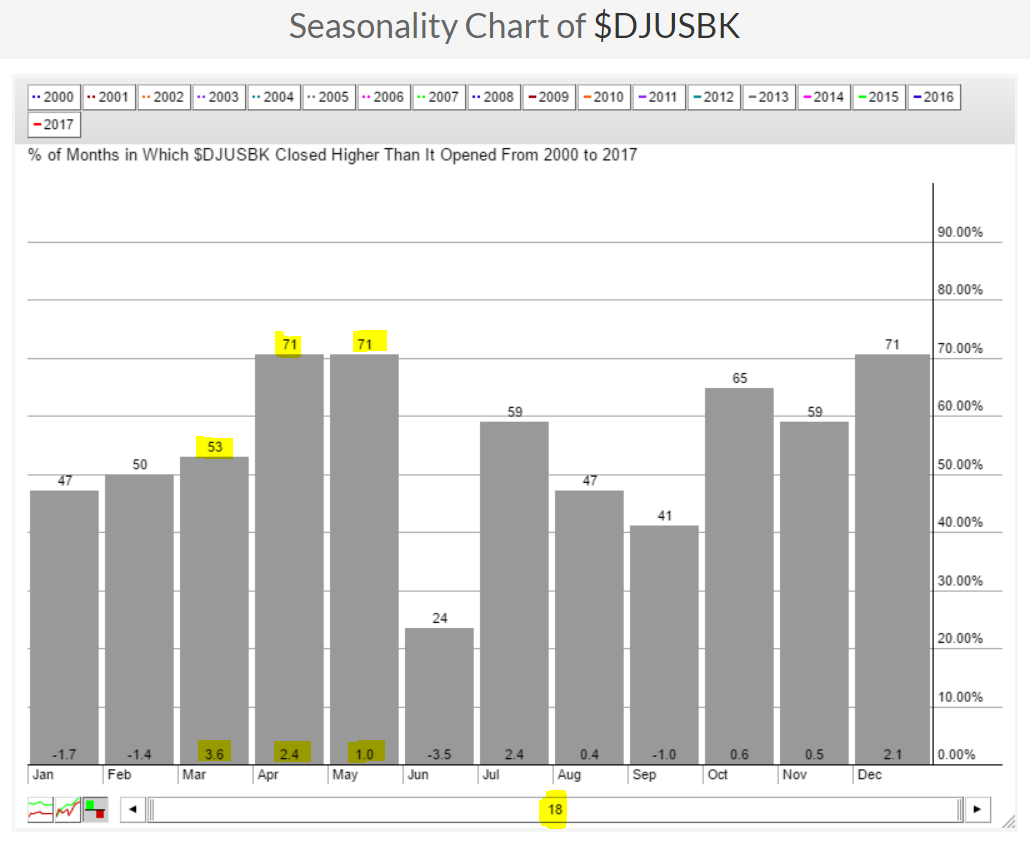 March has only moved higher 53% of the time over the past 18 years, but its average monthly gain of 3.6% is the highest of any month during the year. The three consecutive month return of 7% (adding March through May average returns) is by far the best three consecutive month period during the calendar year.
Key Earnings Reports
(actual vs. estimate):
BBY: 1.95 vs 1.66
DCI: .35 vs .31
DLTR: 1.39 vs 1.33
E: .26 vs (.12)
HPT: .57 vs .55
LOW: .86 vs .79
MYL: 1.57 vs 1.41
(reports after close, estimate provided):
AVGO: 3.02
MNST: .30
Key Economic Reports
January personal income released at 8:30am EST: +0.4% (actual) vs. +0.3% (estimate)
January personal spending released at 8:30am EST: +0.2% (actual) vs. +0.3% (estimate)
February ISM manufacturing index to be released at 10:00am EST: 56.4 (estimate)
January construction spending to be released at 10:00am EST: +0.5% (estimate)
Beige book to be released at 2pm EST
Happy trading!
Tom


