Market Recap for Thursday, March 16, 2017
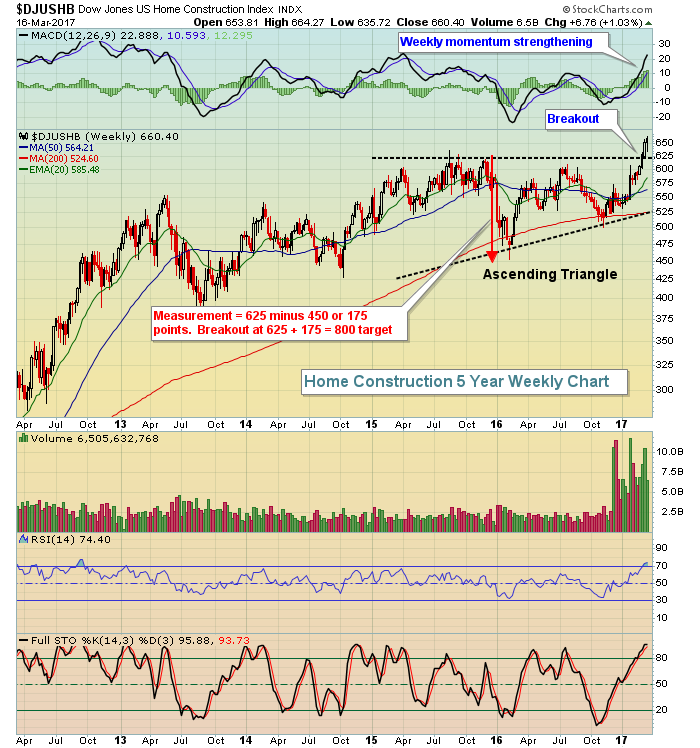
Home construction ($DJUSHB) continued its torrid pace of recent gains, rising another 2% on Thursday. Since January 23rd, the DJUSHB has jumped roughly 20%. That's a great year by any measure, yet we're only talking the past two months performance. Momentum is very strong and volume trends are bullish as well. I see few signs of this group letting up and expect that, based on pattern measurement, the DJUSHB could hit 800 before this relative strength ends. Here's the chart:
 Despite the strength in home construction, the consumer discretionary sector (XLY, -0.01%) was flat for the session. There was modest strength in financials (XLF, +0.16%) and consumer staples (XLP, +0.14%), while utilities (XLU, -1.10%) and healthcare (XLV, -0.97%) took on the brunt of the selling. Biotechnology ($DJUSBT) was the culprit in the healthcare space as that industry lost 1.34% yesterday, failing to hold 1800 support in the process. Take a look:
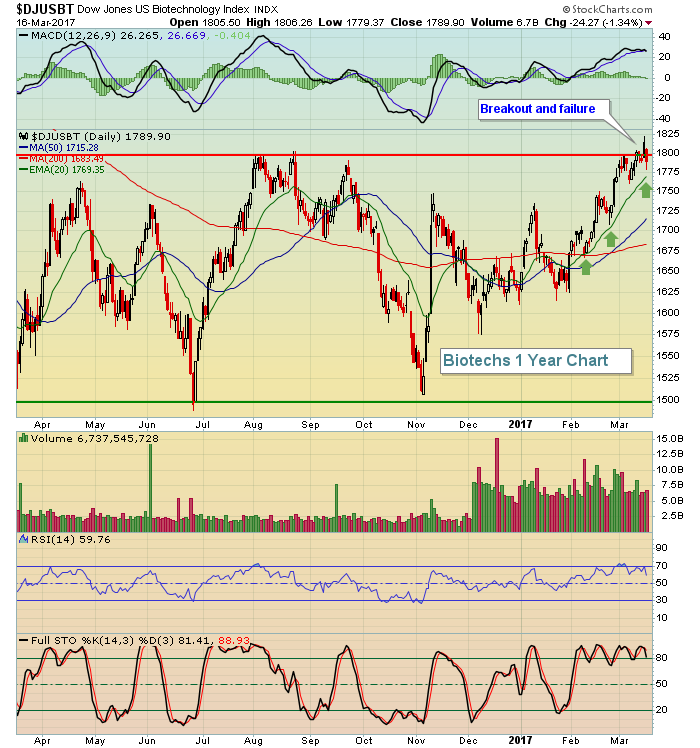 It was a bit disappointing to see the 1800 resistance level broken to the upside on Wednesday, only to see it lost yesterday. However, I believe this failure will be temporary as those rising 20 day EMA tests (green arrows) and the strong MACD demonstrate short-term strength. While not shown here, the weekly EMA is very strong as well and suggests for longer-term investors that rising 20 week EMA support, currently at 1708, should provide excellent support on any extended period of selling. I see this group being a leader in the foreseeable future - similar to the homebuilders.
Pre-Market Action
Today is quadruple witching which falls on the third Friday of the month four times a year (March, June, September and December). It represents a day when contracts for market index futures, market index options, stock options and stock futures all expire simultaneously. It can lead to increased volatility, although in our current market environment, I'd be surprised to see a huge spike.
Crude oil ($WTIC) is up slightly to $49 per barrel. Gold ($GOLD) is continuing its recent push higher as well. Asian markets were fairly flat overnight and that has carried over to Europe this morning. Dow Jones futures aren't much different, rising 24 points as we approach today's opening bell.
Current Outlook
Our major indices are beginning to show signs of slowing momentum, mostly in the form of MACD negative divergences likely to print on our next series of all-time highs. Keep in mind that the MACD is based on price alone and I consider volume to be very important in defining momentum. The MACD does not consider volume at all, which is one of the major limitations of using this indicator as a primary indicator for trading. Nonetheless, we should be aware of the fact that the MACD is falling significantly as equities attempt yet another breakout. Here's the NASDAQ chart as an example:
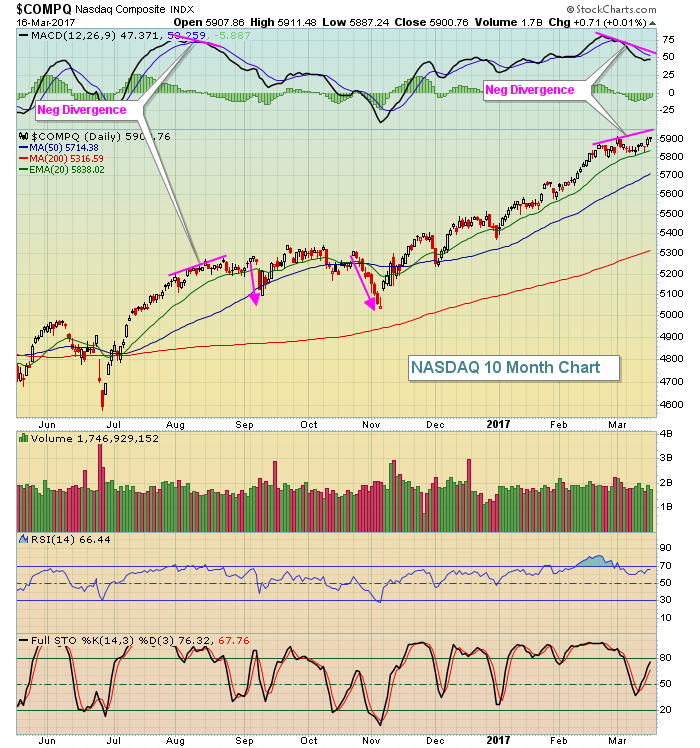 The last time the NASDAQ printed a negative divergence that looks as bad as the one that will print on its next all-time high, the red directional lines reflect the weakness that followed. I'm not suggesting this will occur, but the risks are greater. I typically look for a 50 day SMA test when negative divergences occur to help the MACD push back towards a MACD reset at or near centerline support. The 50 day SMA is at 5714. If we see a temporary break of the 50 day SMA, I'd look to the very bullish weekly chart on the NASDAQ which shows a rising 20 week EMA at 5604. I do not expect any weakness to carry us below that level. So if you're looking at potential downside in the short- to intermediate-term, I'd say it's the range from 5604-5714. Of course, as prices change, so too will these moving averages.
Sector/Industry Watch
Earlier I discussed the homebuilders ($DJUSHB). Here are two stocks within the space that look very technically sound to me:
DR Horton (DHI):
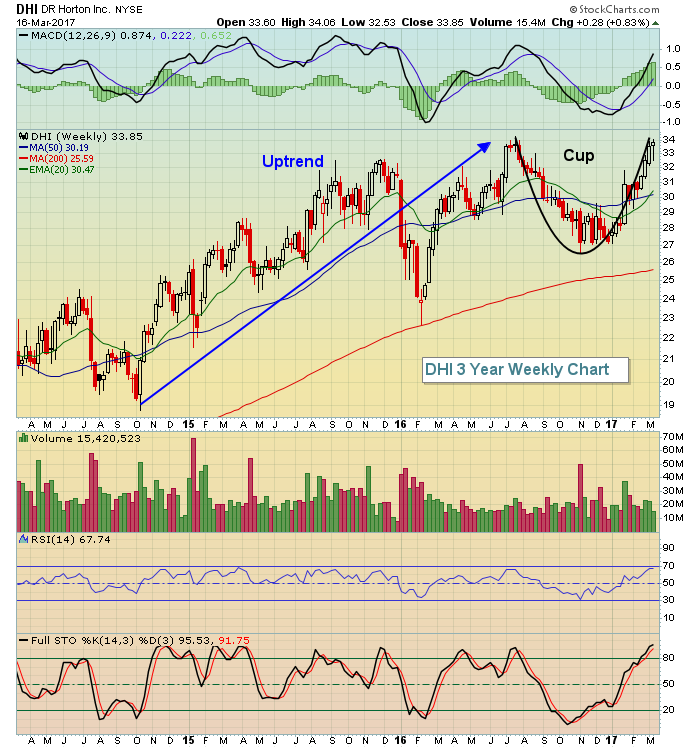 We could see DHI continue to advance as it's not yet overbought on a weekly RSI basis, although it's getting close. Just recognize the cup because if we do pull back, it'll represent the handle in a very bullish cup with handle pattern.
Lennar Corp (LEN):
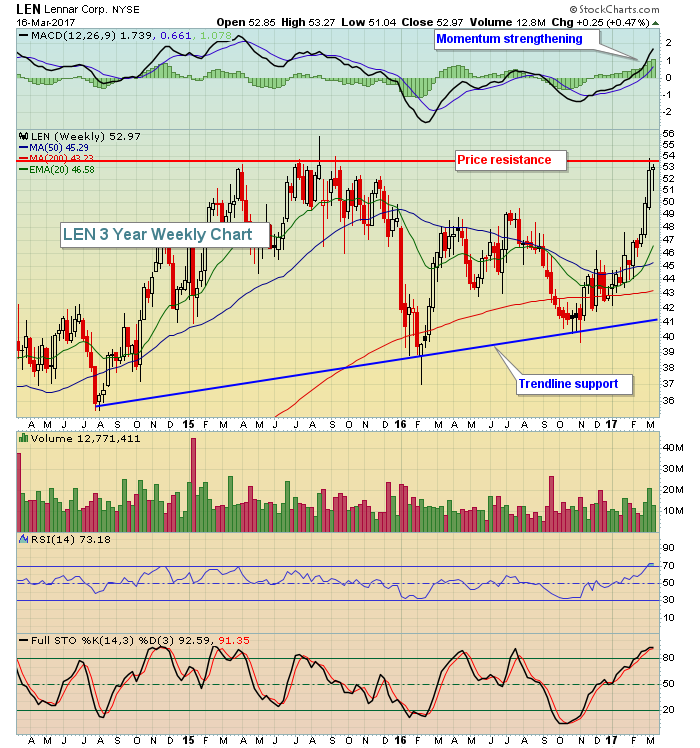 LEN is overbought based on its weekly RSI at 73 and it's also testing very key price resistance. This is another example of a homebuilder that's quite bullish, but in technical need of a selling episode. Taking profits here and seeing if LEN can make the breakout would be prudent in terms of managing risk. A pullback of 5-10%, however, would set this up beautifully for a high reward to risk entry.
Historical Tendencies
I've spent considerable time today discussing homebuilders, so why not look at how they perform seasonally? Here's the chart breaking down the DJUSHB by calendar month over the past 18 years:
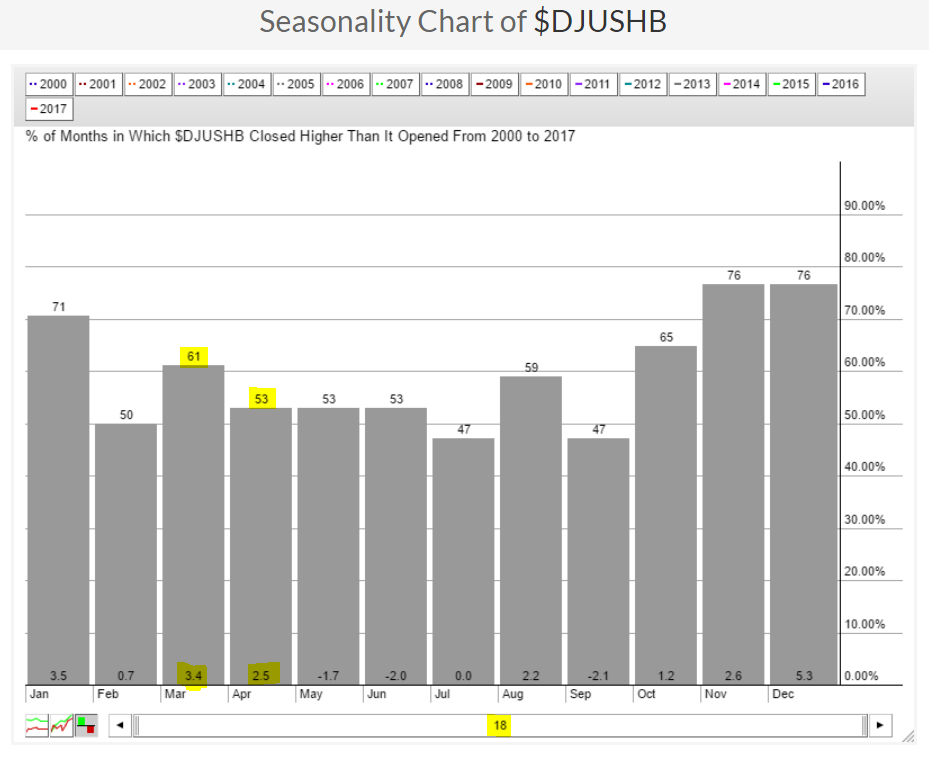 Both March and April produce very solid average monthly returns over the past 18 years. Beyond that, homebuilder performance tends to soften as you can see from the weak average monthly returns in May, June and July.
Key Earnings Reports
(actual vs. estimate):
TIF: 1.45 vs 1.37
Key Economic Reports
February industrial production to be released at 9:15am EST: +0.2% (estimate)
February capacity utilization to be released at 9:15am EST: 75.4% (estimate)
March consumer sentiment to be released at 10:00am EST: 97.2 (estimate)
February leading indicators to be released at 10:00am EST: +0.4% (estimate)
Happy trading!
Tom


