Market Recap for Friday, March 17, 2017
It was another bifurcated day in the market on Friday as rotation continued. The Dow Jones and S&P 500 both posted minor losses while the Russell 2000 led with a 0.40% gain. Utilities (XLU, +0.60%) and industrials (XLI, +0.55%) were the sector winners while financials (XLF, -0.98%) and healthcare (XLV, -0.55%) were the laggards.
Defense stocks ($DJUSDN) helped to lead the industrials as they gained 1.56%. The gains led to another breakout in the group as you can see below:
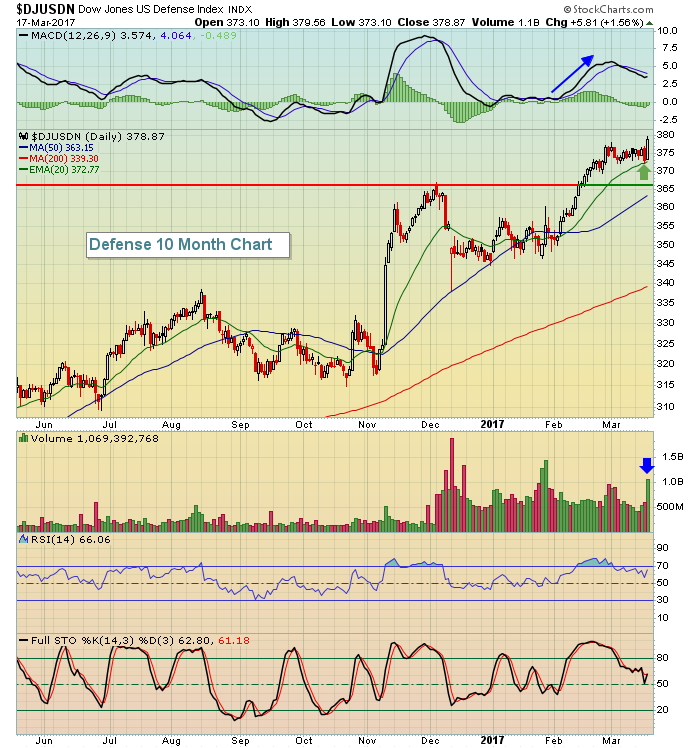 The bounce occurred right off the rising 20 day EMA - perfect technical behavior. I'd look for continued strength here.
Pre-Market Action
There are no key earnings or economic reports expected today, although Chicago Federal Reserve Bank President Charles Evans is appearing live on Fox Business News prior to today's market open. So traders will be looking mostly to action overseas and technical conditions here for direction.
In Asia overnight, key markets were mixed, while in Europe we're seeing fractional losses across the board. The Dow Jones futures are slightly lower as we head into the start of a new trading week just 30 minutes away.
Current Outlook
It wouldn't be a huge surprise to see another push higher in home construction ($DJUSHB). Recently, a 60 minute negative divergence suggested short-term momentum was slowing at a time when 60 minute RSI and stochastic was also pointing to short-term weakness to relieve those two overbought oscillators. Take a look:
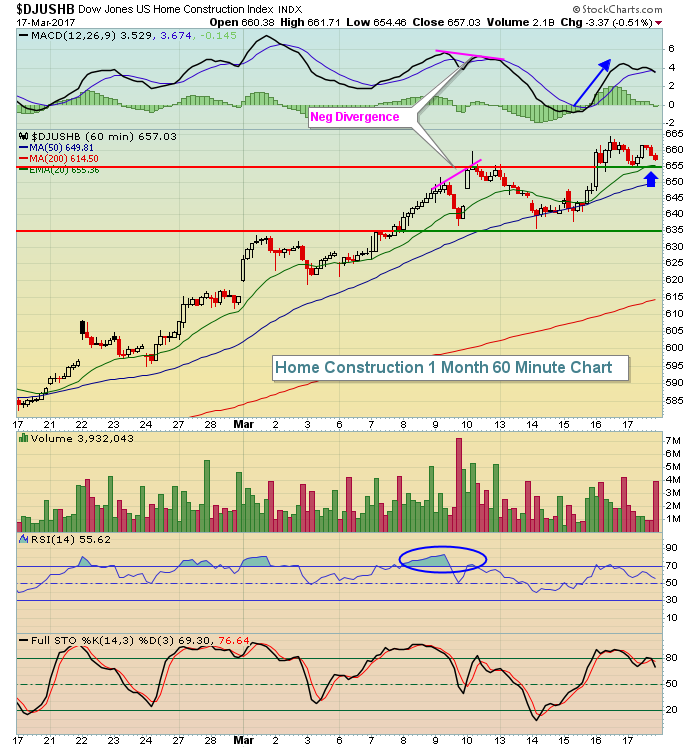 On 60 minute charts, negative divergences tend to take 1-3 days to resolve momentum issues. The negative divergence that formed on the March 10th high followed this pattern, resolving the momentum issues after just a couple days. The 60 minute MACD fell back to its centerline support and the overbought RSI and stochastic were no longer issues and the uptrend resumed. Currently, the 60 minute MACD is bullish. After the latest push higher in price, the MACD moved higher as well. So I look for the rising 20 hour EMA to provide support and that moving average is coinciding with short-term price support near 655. If that price level is lost, then we could see next support at 635. I believe 655 will hold for now.
Sector/Industry Watch
The Dow Jones U.S. Tires Index ($DJUSTR) recently broke out, but is currently printing a negative divergence on its daily chart. However, short-term weakness should be embraced as it would fit in beautifully to a very bullish longer-term picture. Here are the daily and weekly charts on the DJUSTR:
Daily:
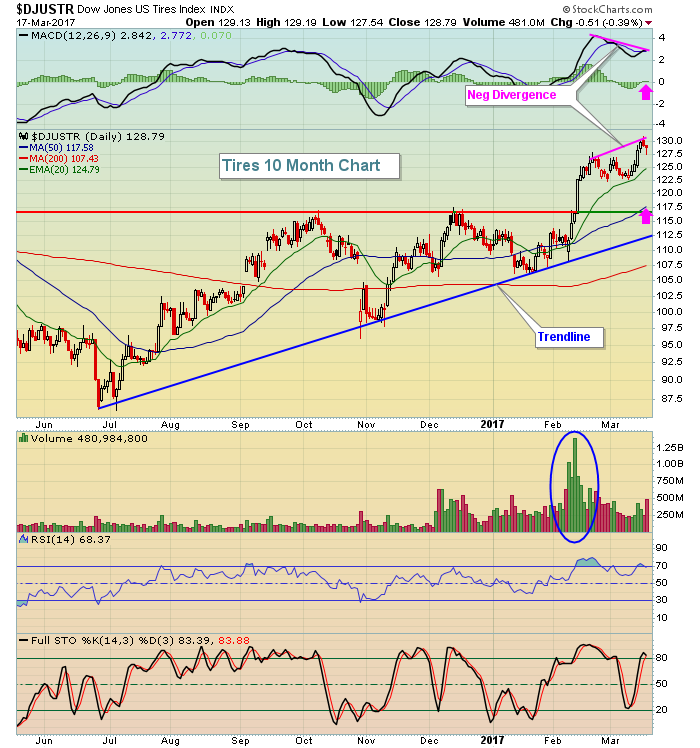 On this daily chart, the DJUSTR has been a bit overbought recently and signs of slowing momentum are evident by the negative divergence. I typically look for MACD centerline resets and/or 50 day SMA tests (pink arrows) for better reward to risk entry points. However, the weekly chart is very strong so we may not see enough short-term selling to hit those levels. Here's the weekly chart:
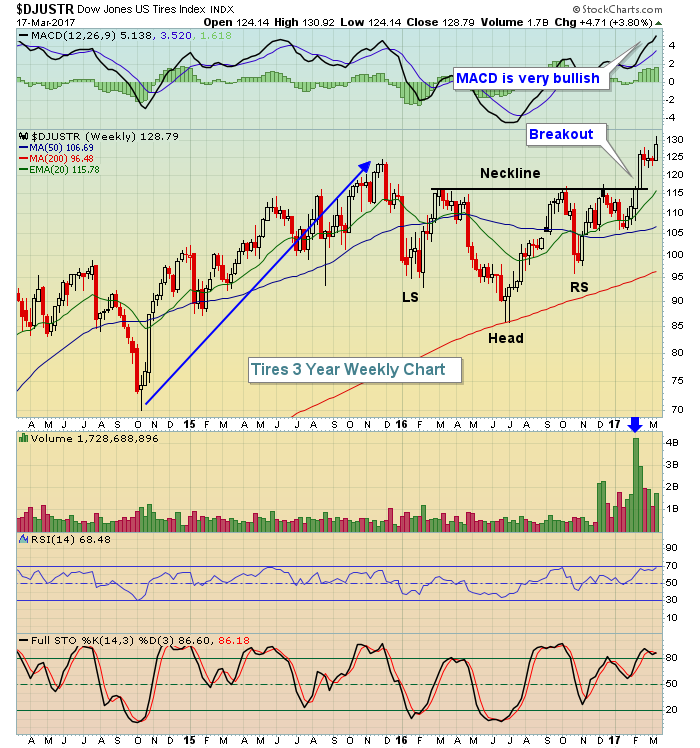 This inverse head & shoulders pattern measures to 146 in time so a pullback to the rising 20 week EMA (currently 115.78) fits right into that daily chart's key support range between trendline support at 112.50 and price support near 117. I would not wait for that level to be tested. Instead, if you like the prospects of tires, I'd build a position as the index falls - if it falls.
Monday Setups
Cooper Tire & Rubber Company (CTB) just broke out of a two year consolidation period that followed a prior uptrend. This technical breakout is likely to lead to further gains in the weeks and months ahead. Here's the current chart:
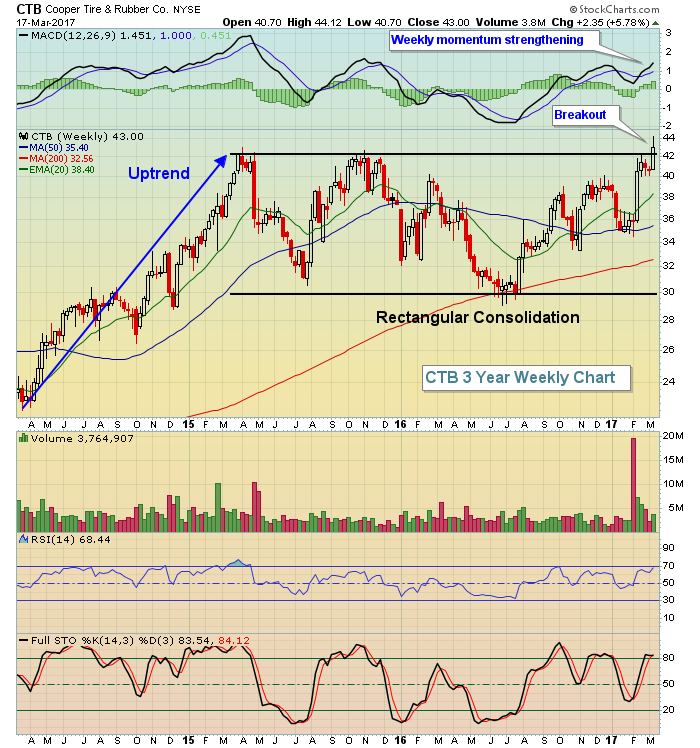 I like sticking with companies that recently beat Wall Street consensus estimates for both revenues and EPS. CTB did just that before breaking out. A month ago, CTB reported revenues and EPS of $784 million and $1.28, respectively, which beat estimates of $767 million and $.93, respectively. The higher volume over the past 5-6 weeks, coupled with higher volume, suggests accumulation. For those looking longer-term, I'd keep an eye on the rising 20 week EMA as a closing stop level.
Historical Tendencies
I just looked at the DJUSTR technically, then provided CTB as a setup to consider in the space. Now let's check out the seasonal tendency for tires. Here it is:
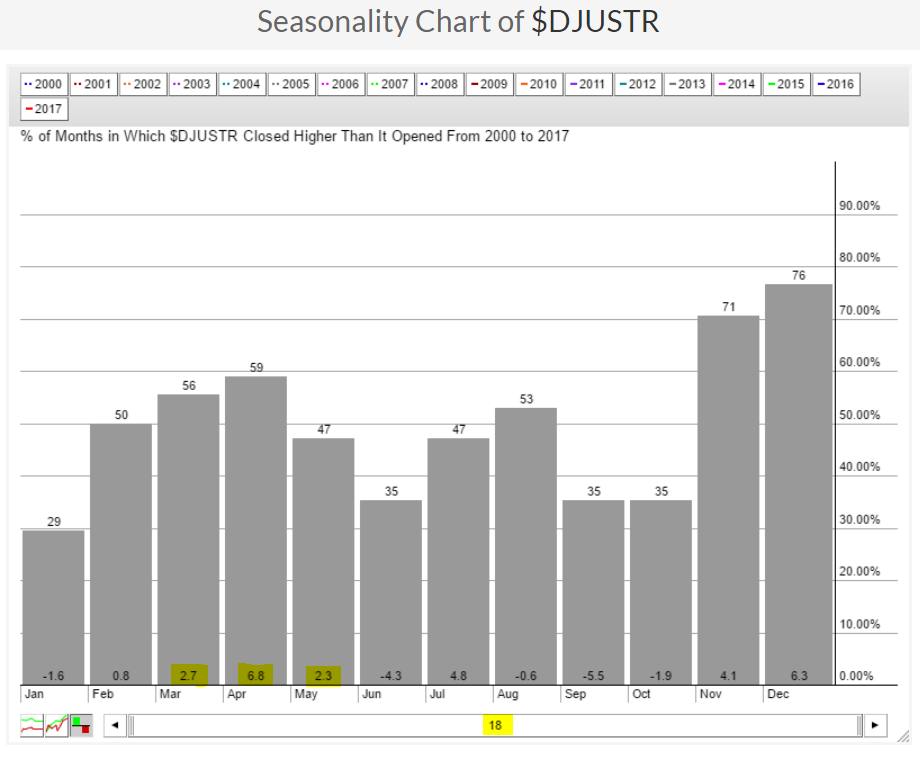 While I'd say November and December easily provide the best chance for rising prices in the DJUSTR, the March to May period is a very close second and its average monthly returns in March, April and May of 2.7%, 6.8% and 2.3%, respectively, over the past 18 years provide a solid foundation for trading this group during the spring months. History and current technical conditions suggest a clear road ahead for tires.
Key Earnings Reports
None
Key Economic Reports
None
Happy trading!
Tom


