Market Recap for Monday, March 20, 2017
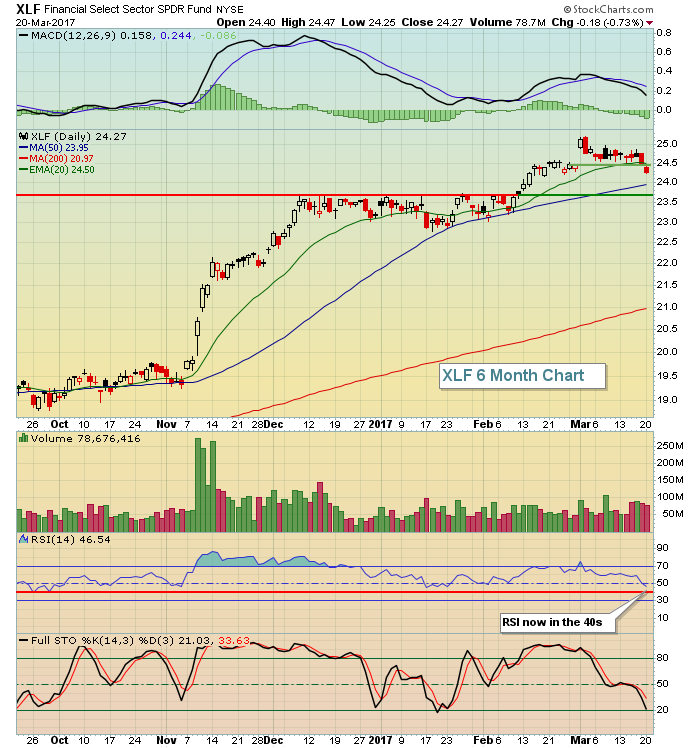
Financials (XLF, -0.73%) led the market lower on Monday as short-term price and gap support was lost on one of the best performing sectors since the early November run. While I don't view this as a big technical development in the long-term, it's worth noting that the door has been opened to further selling in the near-term. Here's the chart of the XLF:
 Yesterday's action took place below recent gap support and volume was moderate. I would now look for the trading range on the XLF to be from 23.70-24.50. The RSI has dipped into the 40s and many times RSI 40 support holds during significant uptrends. Therefore, I'd be looking at this short-term weakness as an opportunity to enter key areas like banks ($DJUSBK) and life insurance companies ($DJUSIL).
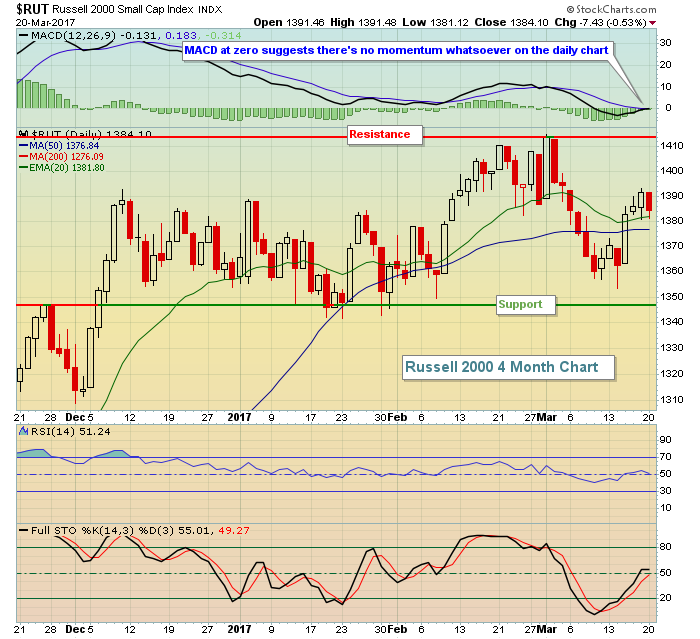
The Russell 2000 was particularly weak among our major indices on Monday, but the weakness didn't deliver any technical blows as yesterday's action was perfectly contained within the Russell 2000's recent trading range as reflected below:
 It would be bullish to see the Russell 2000 break out again and lead the market to the upside. For now, however, we'll just need to be content that small caps are consolidating.
Pre-Market Action
The 10 year treasury yield ($TNX) is up a couple basis points this morning but remains firmly entrenched in its 2.30%-2.62% trading range. This consolidation is the primary reason we're seeing tons of consolidation in financials. Gold ($GOLD) and crude oil ($WTIC) are fairly flat this morning.
Overseas, Asian markets were mixed overnight and we're seeing that same environment in Europe this morning. Dow Jones futures are 17 points as we approach the opening bell - just 30 minutes away.
Current Outlook
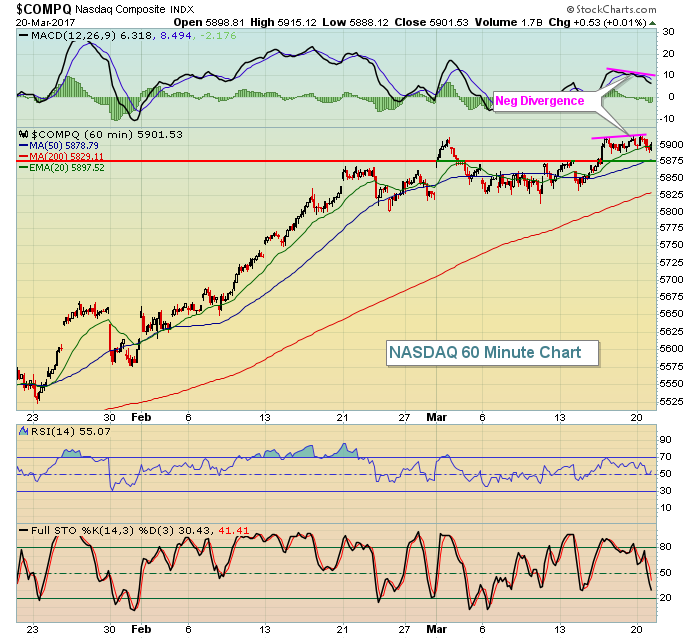
The NASDAQ is struggling a bit with a short-term 60 minute negative divergence that suggests there are very slight momentum issues and that could be holding the market back from gaining further. Take a look at the recent chart and the pink lines that highlight the negative divergence:
 I didn't annotate it, but there's a cup that began forming at the high in early March and was completed with the recent high. So a pullback to test the 50 hour SMA could form a bullish handle from which the NASDAQ launches again.
Sector/Industry Watch
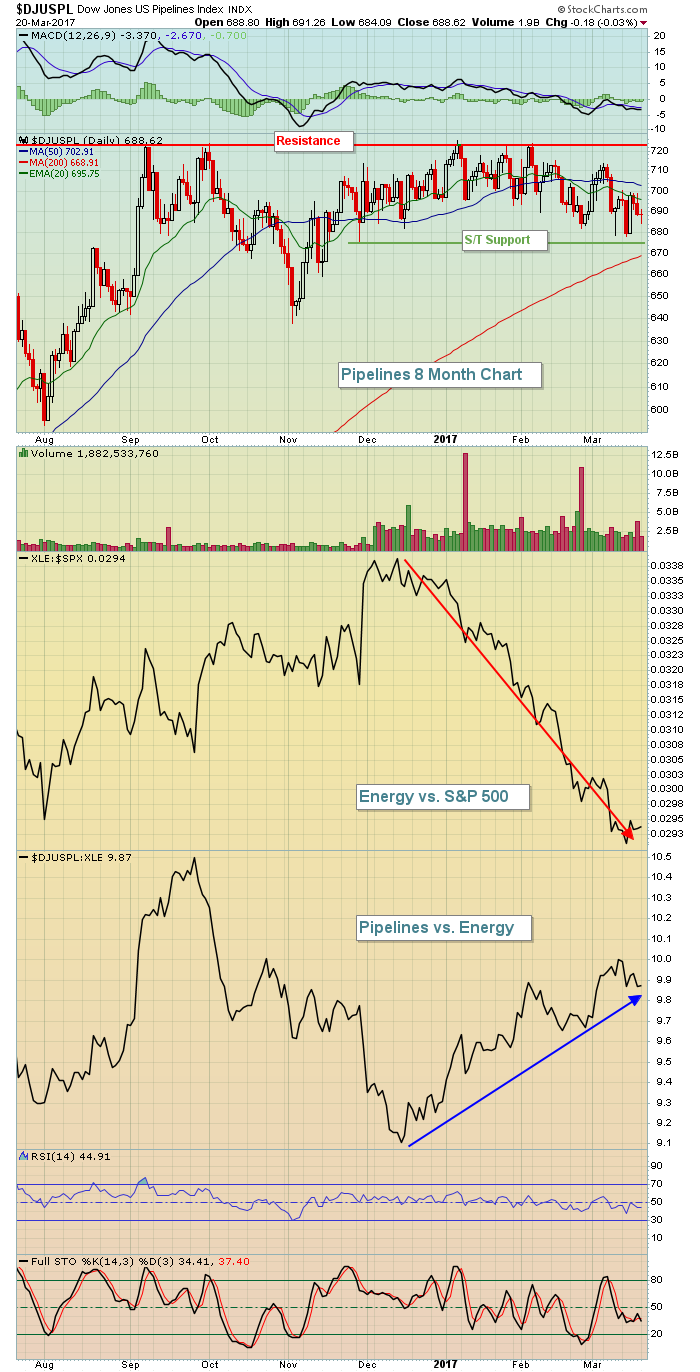
The Dow Jones U.S. Pipelines Index ($DJUSPL) continues to outperform its energy peers. Unfortunately, energy has been very weak relative to the benchmark S&P 500. Should energy begin to lead the market, I'd expect the DJUSPL to surge higher and through key price resistance as reflected below:
 Pipelines have actually hung in very nicely given the very weak environment in energy stocks the past few months. While energy continues to decline on a relative basis vs. the S&P 500, there's been excellent relative strength in pipelines vs. its energy peers. A close above 725 on the DJUSPL would be a very bullish development technically.
Historical Tendencies
Since 1950, March has been the fourth best calendar month on the S&P 500, producing annualized returns of +14.81%. Like most months, however, the second half of the month is not as bullish as the first half. Here is a breakdown of March performance on the S&P 500 over the last 66 years:
March 1-18: +27.74%
March 19-31: -3.40%
Key Earnings Reports
(actual vs. estimate):
CCE: .46 vs .46
GIS: .72 vs .71
LEN: .59 vs .56
(reports after close, estimate provided):
FDX: 2.64
NKE: .52
PBR: .18
SLW: .17
Key Economic Reports
None
Happy trading!
Tom


