Market Recap for Monday, April 17, 2017
If you're in the bullish camp, you have to be breathing a sigh of relief following yesterday's action. It was only one day, but after the bulls' grip on the market really seemed to be slipping at the end of last week, we saw all four of the aggressive areas of the market perform well on Monday, leading a very nice rally that included banks ($DJUSBK) recapturing neckline support. They're certainly not out of harm's way, but moving back above 390 quickly is a start. Climbing back above the declining 20 day EMA, currently near 403, is job one so the range between Thursday's low at 387 and 403 is what we need to focus on short-term. Here's the visual look:
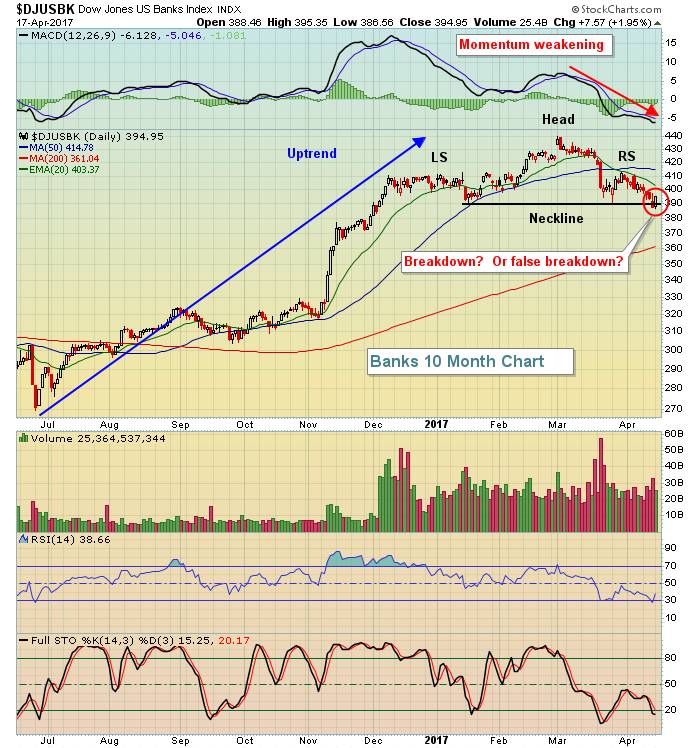 There's a lot going on technically on the bank chart so it'll be interesting to see how it resolves. The MACD is quite bearish, suggesting the next 20 day EMA test from underneath will fail. These false breakdowns make trading especially difficult so be careful as the whipsaw action near-term may continue. Bank of America's earnings came out this morning and they were very strong - both top and bottom lines handily beat estimates. So let's see how that impacts the DJUSBK. Again, watch the technical range and avoid getting caught up in the headline news.
While financials (XLF, +1.75%) were the obvious leader yesterday, industrials (XLI, +1.09%), consumer discretionary (XLY, +1.03%) and technology (XLK, +0.92%) also performed extremely well. This was the first time in awhile where we've money aggressively move into riskier areas of the market. Heavy construction ($DJUSHV) was a beneficiary of the strength in industrials and is featured below in the Sector/Industry Watch section.
Pre-Market Action
Transportation stocks ($TRAN) were very strong on Monday, rising 1.31% to stave off the possible loss of March support. CSX Corp (CSX) will be one of the first key transportation stocks to report its latest quarterly earnings when it delivers its report after the close tomorrow. I'll be watching to see how these stocks perform into earnings. The TRAN has solid near-term price support at 8800, but will it hold?
Crude oil ($WTIC) is down another 0.5% this morning as it continues to fall from its recent high. Asia was mixed overnight but losses are fairly significant in Europe. Dow futures are down 60 points currently.
Current Outlook
Sustainable rallies have historically been accompanied by money rotating towards aggressive areas of the market. My favorite ratio (XLY:XLP), in my opinion, provides one of the best signals to determine whether to trust a rally or not in the benchmark S&P 500. Below is the current state of this ratio compared to the S&P 500:
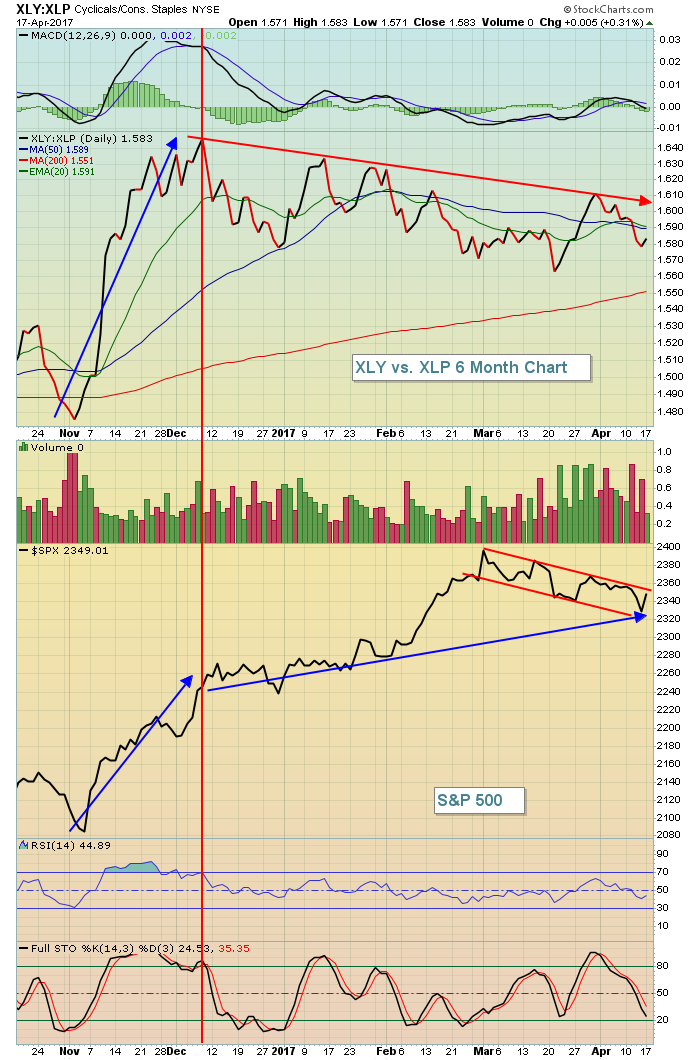 The last four months of this rally have been accompanied by a declining XLY:XLP ratio. Granted, the XLY:XLP ratio soared just prior so a period of consolidation certainly is to be expected. But I'm a little concerned that money has rotated in recent months to other "relatively safe" areas like utililities, REITs and treasuries - to name a few. Given this backdrop, watch the S&P 500 carefully because a breakdown below the 2300-2310 area would be quite meaningful technically because of the warning signs in play.
Sector/Industry Watch
The Dow Jones U.S. Heavy Construction Index ($DJUSHV) rallied off a MACD positive divergence, leading industrials on Monday. At first glance on this candlestick chart, it's difficult to see the positive divergence but check out the line chart which is reflected just below it:
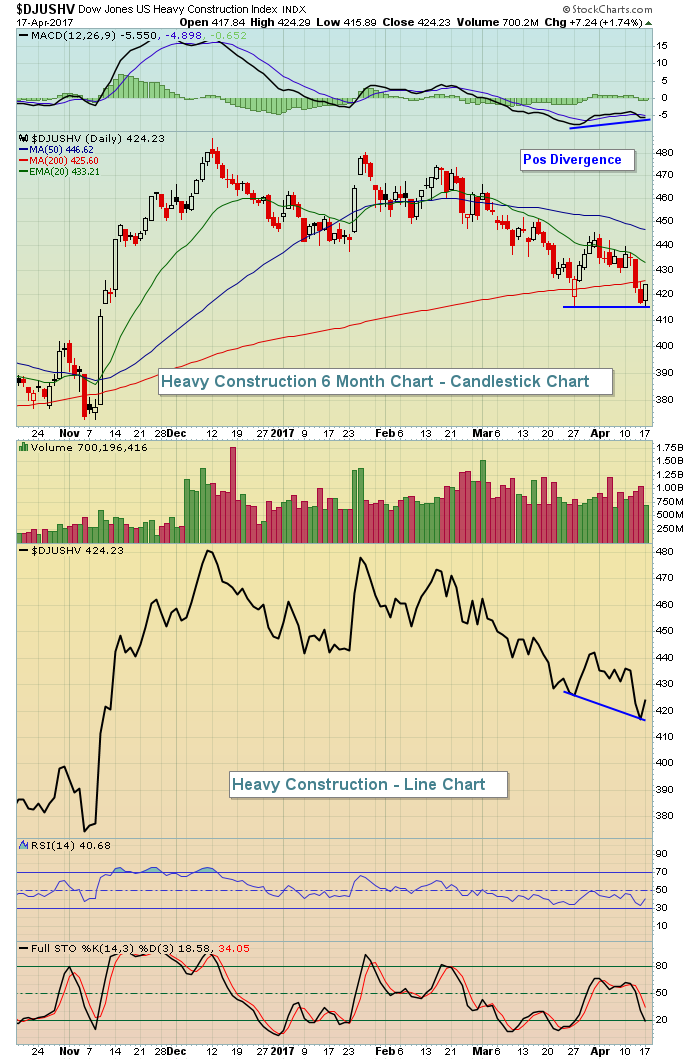 Always remember the MACD is based on closing prices, not opening or intraday prices. Looking at a candlestick chart, it appears that the DJUSHV never printed a fresh low to establish the positive divergence. But one advantage of the line chart (and there aren't many) is that it only connects closing prices so the divergence becomes much more obvious.
Historical Tendencies
Looking ahead, the small cap Russell 2000 index ($RUT) has been the best performing major index during the month of May over the past two decades. But while it's risen 63% of the time over the last 20 years, the average gains are just 0.2%. May really acts as a bridge from a mostly bullish first four months of the calendar year to a much more neutral, or even bearish, period that runs through September.
Key Earnings Reports
(actual vs. estimate):
BAC: .41 vs .35
CMA: 1.02 vs 1.01
GS: 5.15 vs 5.38
HOG: 1.05 vs .99
JNJ: 1.83 vs 1.77
OMC: .97 vs .96
SCHW: .37 (est)
UNH: 2.37 vs 2.18
(reports after close, estimate provided):
IBM: 2.34
ISRG: 3.97
LRCX: 2.54
YHOO: .08
Key Economic Reports
March housing starts released at 8:30am EST: 1,215,000 (actual) vs. 1,262,000 (estimate)
March building permits released at 8:30am EST: 1,260,000 (actual) vs. 1,250,000 (estimate)
March industrial production to be released at 9:15am EST: +0.4% (estimate)
March capacity utilization to be released at 9:15am EST: 76.0% (estimate)
Happy trading!
Tom
