Market Recap for Friday, April 21, 2017
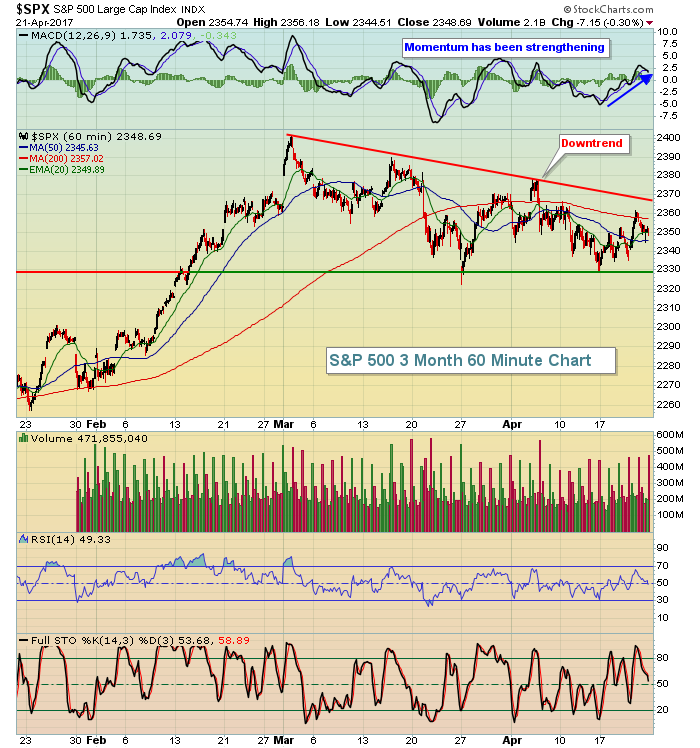
The S&P 500 trended lower from midday Thursday through Friday's close and that extended a much longer downtrend that began after the gap higher back on March 1st. Futures are very bright green this morning, however, so we could finally see an end to the consolidation period that our major indices have been dealing with. Below is a picture of what the S&P 500 has been battling for the past 7-8 weeks:
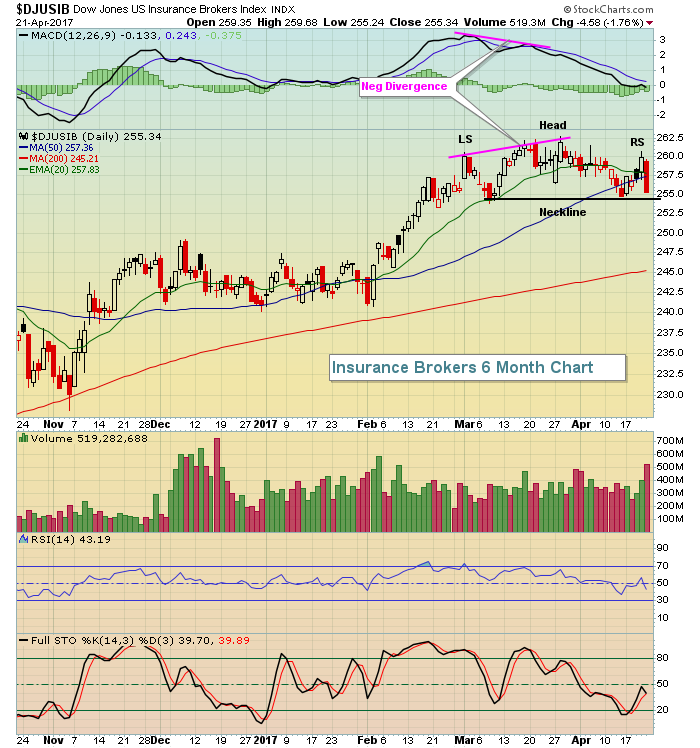
 While the overall indices have been consolidating, we've seen plenty of sector and industry group rotation and fresh breakouts. Others are continuing to consolidate and resting at or near support and poised to resume leadership. Friday's action emphasizes this fact as financial stocks (XLF, -1.03%) were the worst performing sector and its primary laggard - insurance brokers ($DJUSIB, -1.76%) - fell back to price support as you can see below:
 The defensive utilities sector (XLU, +0.51%) represented the only sector that made any significant progress on Friday with most sectors lower.
Pre-Market Action
Global markets are rallying in unison today as markets applaud the French election results over the weekend. In Asia, the Tokyo Nikkei ($NIKK) rallied more than 250 points and climbed back above its declining 20 day EMA for the first time in a month. In Europe, the French CAC ($CAC) is up nearly 4.5%, easily breaking above recent price highs. The German DAX ($DAX) has broken to an all-time high, setting the stage for higher prices on the benchmark S&P 500.
Dow Jones futures are higher by 215 points 30 minutes from the opening bell.
Current Outlook
The NASDAQ looks very strong, easily the strongest of our four major indices (the Dow Jones, S&P 500 and Russell 2000 are the others in my view). This technology-laden index nearly broke out on Friday and with the solid pre-market action, the NASDAQ will likely open at its highest level ever. Here's the current look at its bullish daily chart:
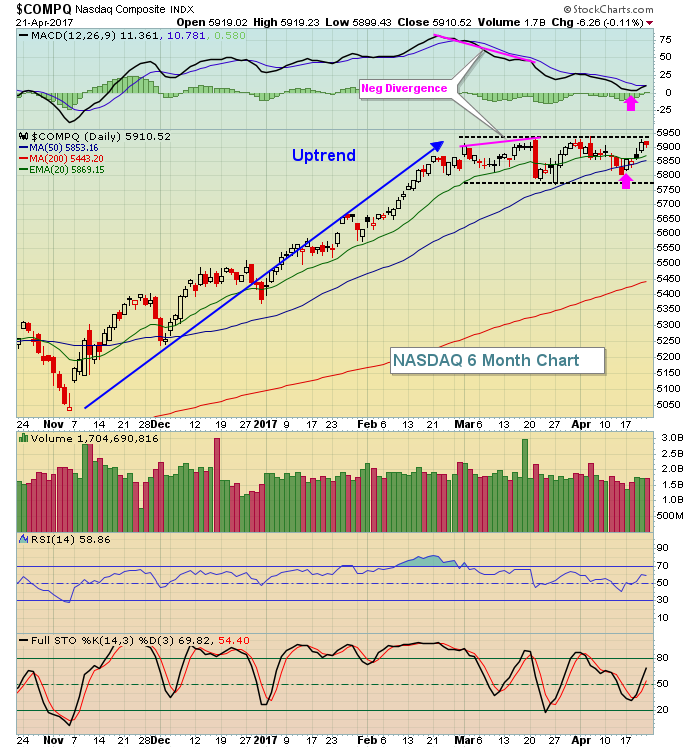 The consolidation occurred after a negative divergence formed on the mid-March high. But the consolidation has done exactly what you'd hope for - to allow the MACD to reset back to centerline support and price to retreat back to 50 day SMA support (pink arrows). The NASDAQ now appears ready to break out into a sustainable rally.
Sector/Industry Watch
Earlier I discussed the consolidation of insurance brokers. In the healthcare space (XLV), we have biotechs that have pulled back and are literally resting on their rising 20 week EMA, looking to break their recent downtrend as well. Perhaps today will be the day. Check it out:
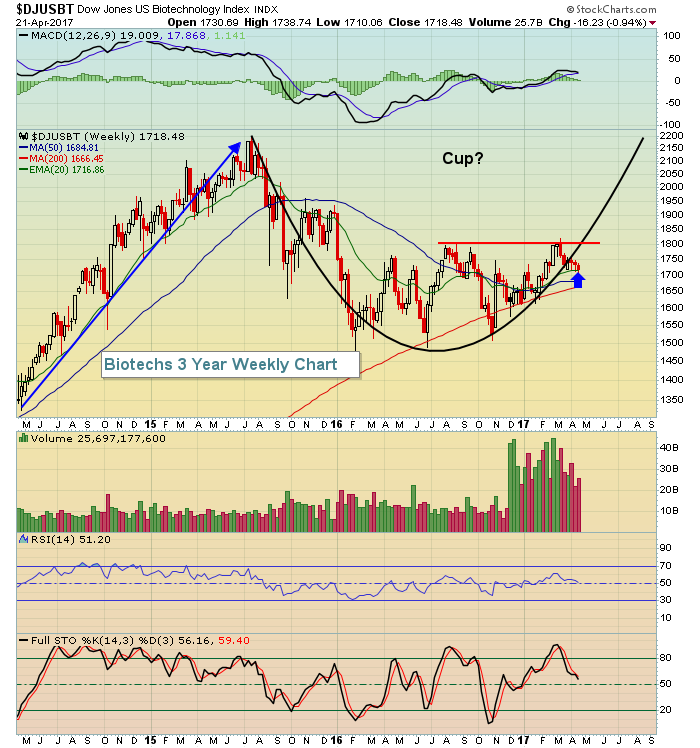 The next step in this bullish continuation cup with handle forming would be a breakout above recent price resistance just above 1800 (red horizontal line).
Monday Setups
Patience is a virtue.....or so I've heard. It certainly pays dividends in stock market trading. It's important to recognize patterns but not to get tied up in the emotion of "chasing" performance. After Garmin's (GRMN) last gap higher on earnings and with massive volume, the stock's RSI pushed above 70 and it's almost never a great idea to buy stocks after that type of move. Instead, GRMN has been consolidating and its RSI fell back close to 30 (I actually prefer RSI 40 support holding). The result has been a very bullish ascending triangle forming. Check it out:
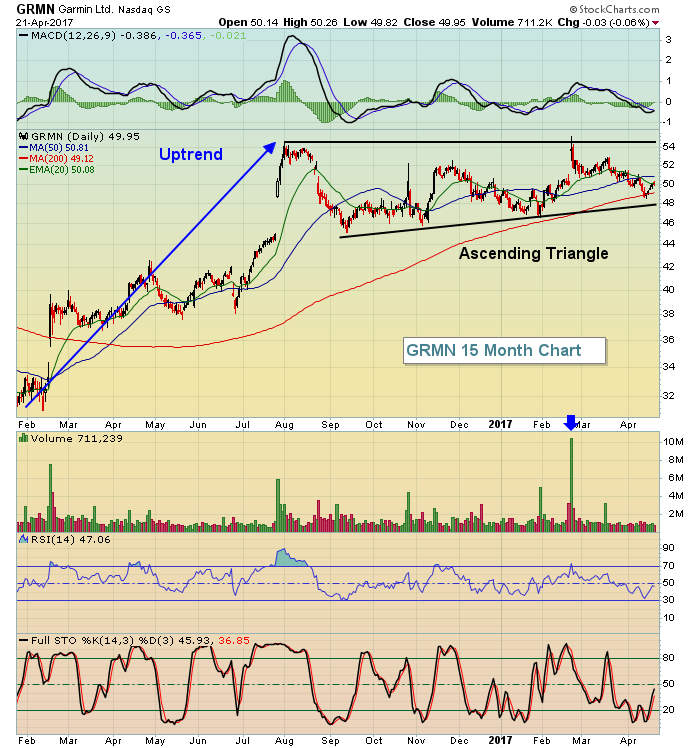 I'd expect to see GRMN begin to move higher and back toward its double top just above 54.
Historical Tendencies
I pointed out above that biotechs could be poised to move higher off 20 week EMA support. Historically, that would make sense as the May through July period is the best three consecutive month period for the group. Take a look at the seasonal pattern below:
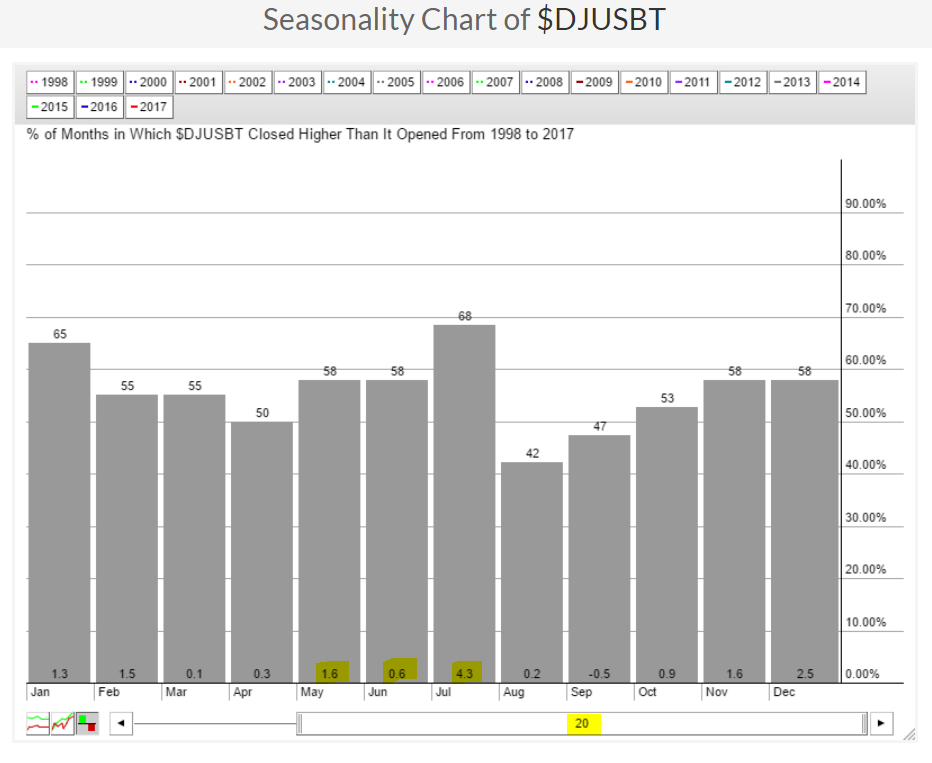 Summer time is typically a period of consolidation or selling for stocks, but not the biotechs. The past two decades show that summer can be the cure for what ails the group.
Key Earnings Reports
(actual vs. estimate):
HAL: .04 vs .04
HAS: .43 vs .37
ITW: 1.54 vs 1.45
KMB: 1.57 vs 1.54
(reports after close, estimate provided):
ABX: .24
AMP: 2.52
CCI: 1.16
CNI: .84
ESRX: 1.32
NEM: .23
TMUS: .35
WHR: 2.67
Key Economic Reports
None
Happy trading!
Tom


