Market Recap for Thursday, April 20, 2017
We've yet to see the breakouts in our major indices that we're looking for, but yesterday's rally was quite bullish with leadership coming from the small cap Russell 2000 ($RUT, +1.24%), financials (XLF, +1.69%) and industrials (XLI, +1.21%). All three of those led the huge rally back in November and December - on an absolute and relative basis - so continuation of that earlier relative strength would bode well for U.S. equities. Here's the visual:
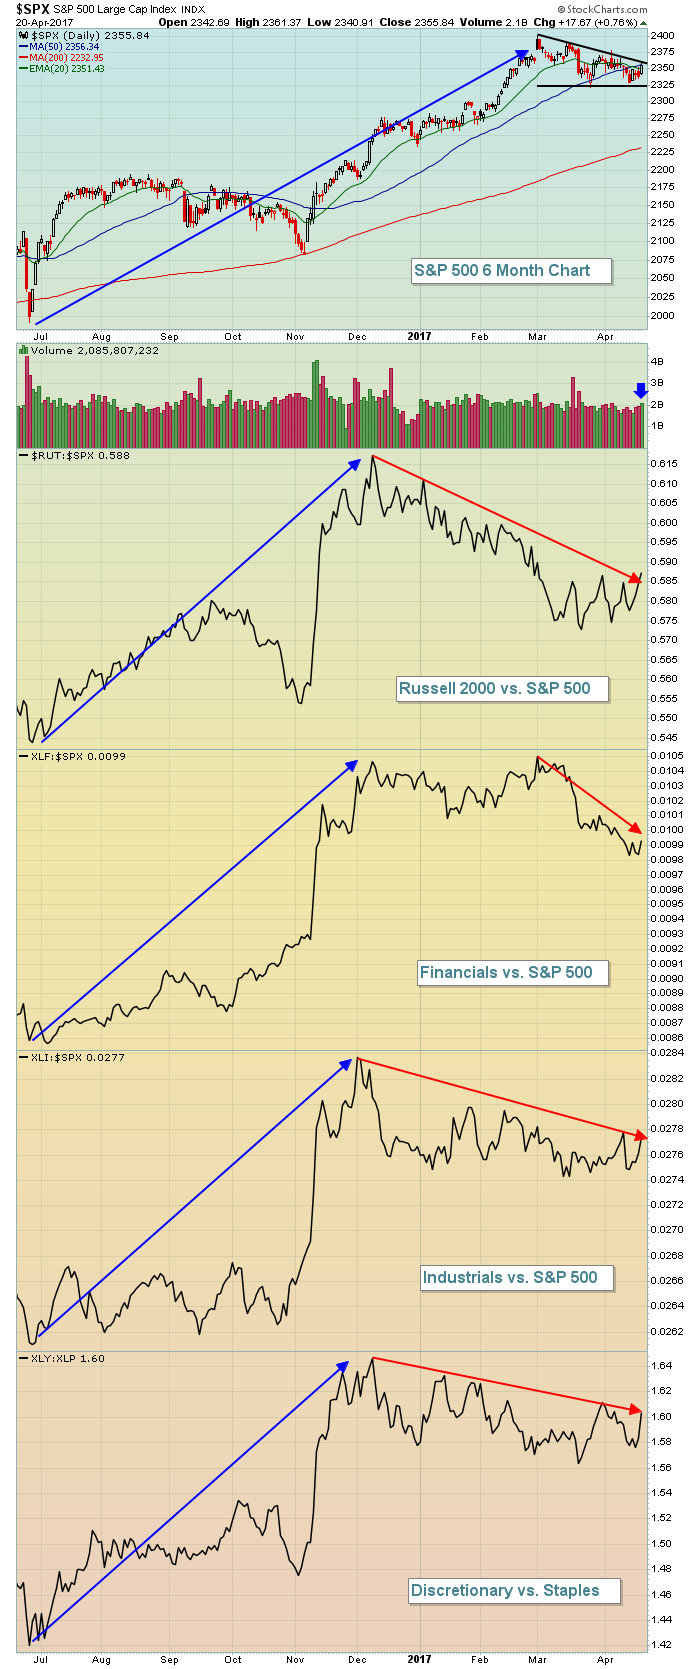 Recently, one of the questions or concerns I've had is the relative weakness of each of these groups. But relative consolidation occurs during bull markets. I want to see relative strength resume in these areas on another bull market advance and, at least for one day, it resumed in a big way. In particular, the Russell 2000's relative strength ($RUT:$SPX) ended yesterday at a six week high - a bullish development indeed.
The 10 year treasury yield ($TNX) appears to have at least stabilized after losing key short- to intermediate-term support near 2.30%. Climbing back above 2.30% would provide a signal that traders are moving away from treasuries, a possible catalyst to drive equity prices higher.
Pre-Market Action
Earnings this morning were very strong, including General Electric's (GE), which posted earnings well above consensus estimates (.21 vs .17). For all of the key earnings this morning, check them out in the Key Earnings section below.
Technically, the French CAC ($CAC) is nearing both 2015 price resistance and its almost two decade downtrend line as it approaches its Presidential election. There is some strength this morning in Germany as the DAX is up close to 0.50%. Overnight, Tokyo's Nikkei ($NIKK) rose just over 1% with other key indices flat.
Dow Jones futures are looking to add to yesterday's gains, up 13 points with 30 minutes left to the opening bell.
Current Outlook
There are a few things to watch for in the next few trading days. First, the NASDAQ open/close resistance is at 5923 while intraday resistance resides at 5936. This index is laden with technology companies and has consolidated in bullish fashion the past few months as its daily MACD tested centerline support and its RSI touched 40. Many times this is a launching spot for another big rally and thus far that's what we've seen. A closing breakout above 5923, accompanied by further strength in aggressive sectors would resume our 8 year bull market. Check out the current NASDAQ chart:
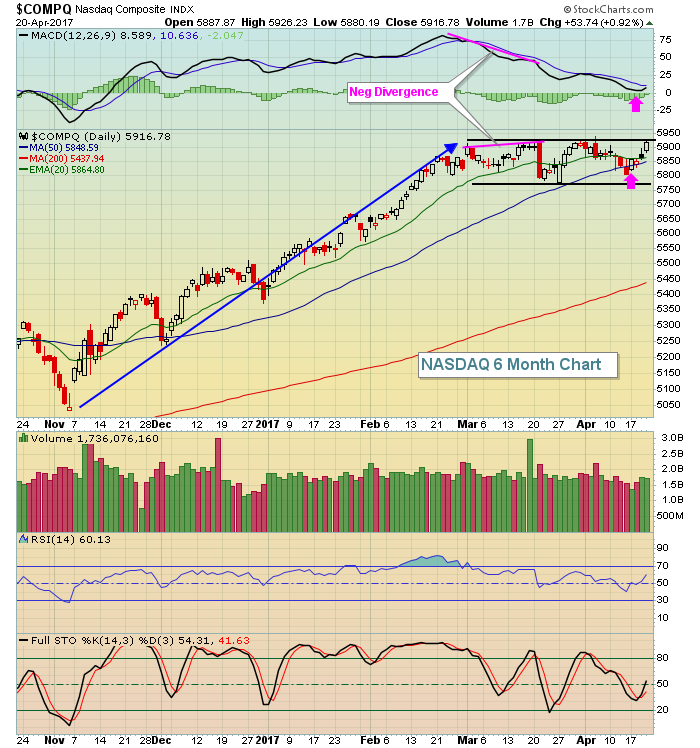 The uptrend from November into February is quite obvious, but the rally did run out of steam as you can see from the highlighted negative divergence. The pink arrows mark the levels to look for, namely a MACD centerline reset and a 50 day SMA test. This latest rally on the NASDAQ has been strong, coming off of RSI 40 and the bull market resumption would be confirmed with a heavy volume breakout.
Sector/Industry Watch
The Dow Jones U.S. Restaurants & Bars Index ($DJUSRU) has turned decidedly bullish in recent weeks. Like many other industry groups, it was biding its time in a consolidation pattern, but it's recently broken out again and appears poised for further gains ahead. Check out the chart:
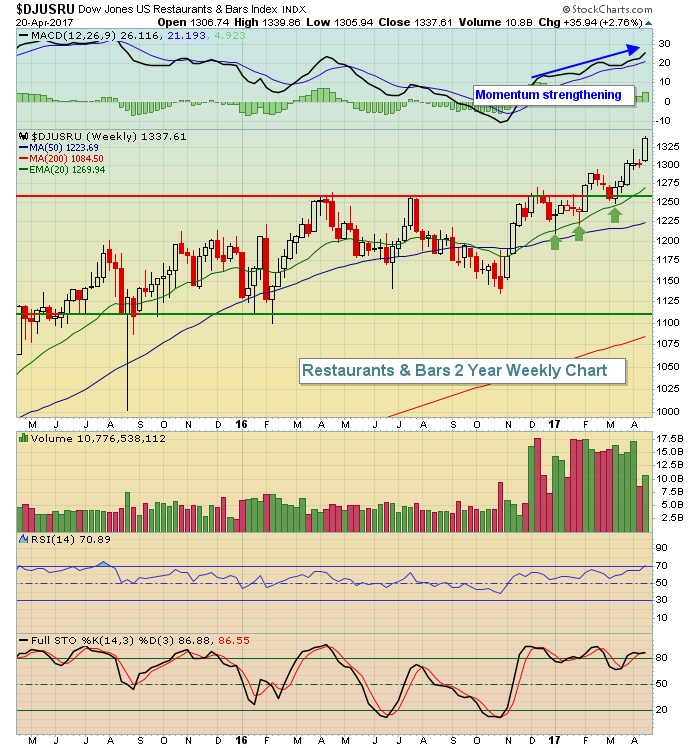 Pullbacks to test the rising 20 day EMA (green arrows) would represent solid entry levels into your favorite restaurant stocks.
Historical Tendencies
As we approach May, you might want to keep an eye on the Dow Jones U.S. Waste & Disposal Services Index ($DJUSPC). It's the second best performing industry group in the month May over the last 18 years (trails only tobacco stocks). Technically, the DJUSPC is on the verge of a bull flag breakout that could carry the group higher during one of its best seasonal periods of the year. Here's the seasonality chart:
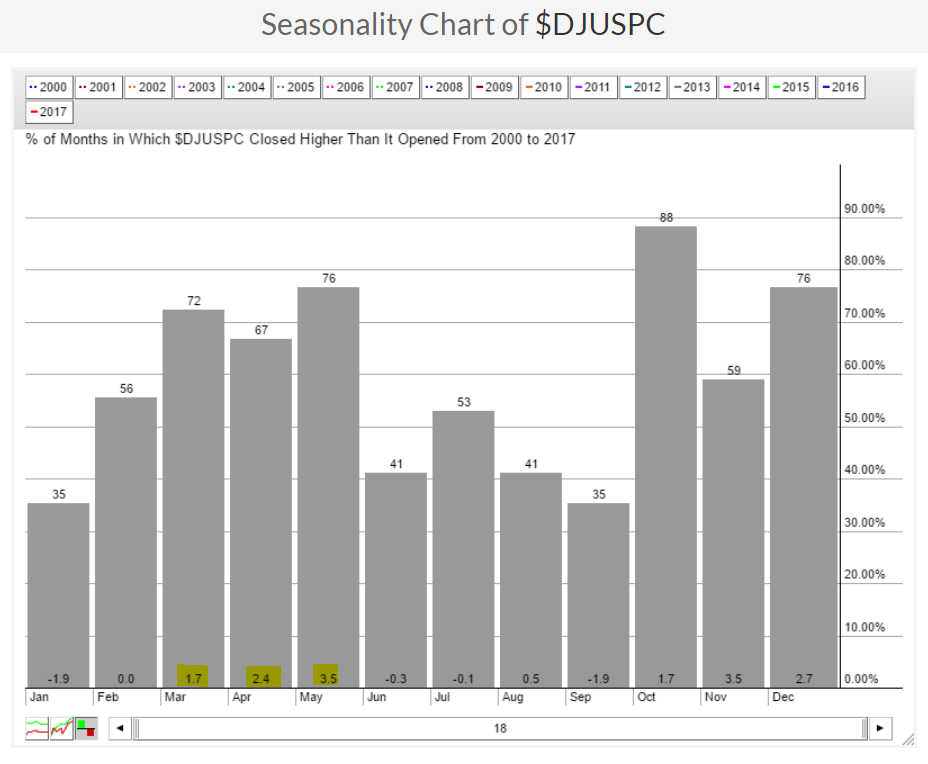 There's summer weakness ahead, however, so the next push higher could be the last before fall bullishness resumes.
Key Earnings Reports
(actual vs. estimate):
COL: 1.34 vs 1.31
GE: .21 vs .17
HON: 1.66 vs 1.62
SLB: .25 vs .25
STI: .87 vs .84
SWK: 1.29 vs 1.19
Key Economic Reports
March existing home sales to be released at 10:00am EST: 5,605,000 (estimate)
Happy trading!
Tom


