Market Recap for Tuesday, April 4, 2017
U.S. equities opened lower on Tuesday, but steadily marched higher throughout the day, finishing with mostly small gains across the board. The small cap Russell 2000 was an exception as it fell for a second consecutive session. That follows a winning streak of seven straight days just prior. Energy (XLE, +0.73) led the recovery with materials (XLB, +0.36%) and utilities (XLU, +0.31%) also performing well. The latter has been attempting a breakout, but with two key obstacles. First, there's a clear negative divergence indicative of slowing momentum and, second, the 10 year treasury yield ($TNX) is very close to support. The XLU would benefit from a breakdown in the TNX, but I would not expect one given the pattern. Check this out:
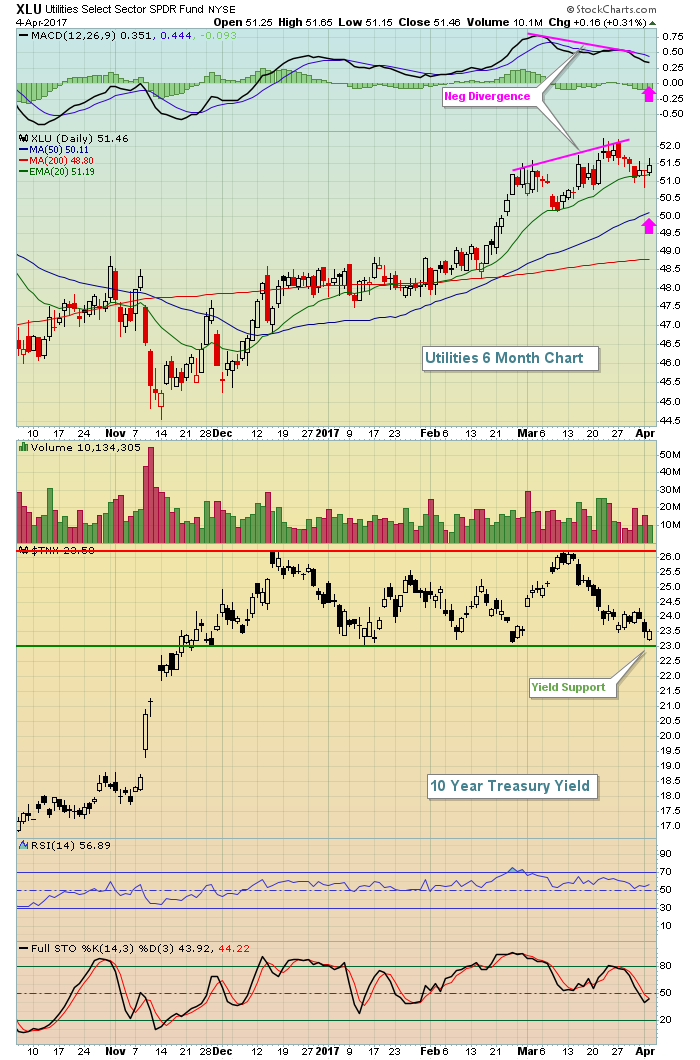 I don't expect to see the TNX break below 2.30% support and a bounce off this support area will likely be the catalyst to reset the MACD on the XLU. The pink arrows above highlight the potential MACD centerline and 50 day SMA tests that I look for after negative divergences emerge.
Consumer discretionary stocks (XLY, -0.16%) were the weak link on Tuesday as apparel retailers ($DJUSRA) closed at their lowest level since early July. The DJUSRA is featured in the Sector/Industry Watch section below.
Pre-Market Action
After hitting a low of 2.32% yesterday, the TNX is up two basis points this morning to 2.37%. Keep in mind that the FOMC minutes will be released later today at 2pm EST. Traders will be reviewing these minutes closely so it'll be important to see how the treasury market reacts.
Crude oil ($WTIC) continues its recent rise as it's up 1.25% this morning to 51.67 per barrel. The recovery has helped lead the energy sector to relative strength over the past week.
The ADP employment report came in much stronger - 263,000 actual vs. 170,000 estimate - than expected and Dow Jones futures have surged higher by 54 points from its flat level prior to the report. Global markets are mostly higher as well.
Current Outlook
The NASDAQ had been flashing short-term momentum warnings on its hourly chart and the recent weakness alleviated those issues. Look at the hourly negative divergence that appears on the NASDAQ's 60 minute chart:
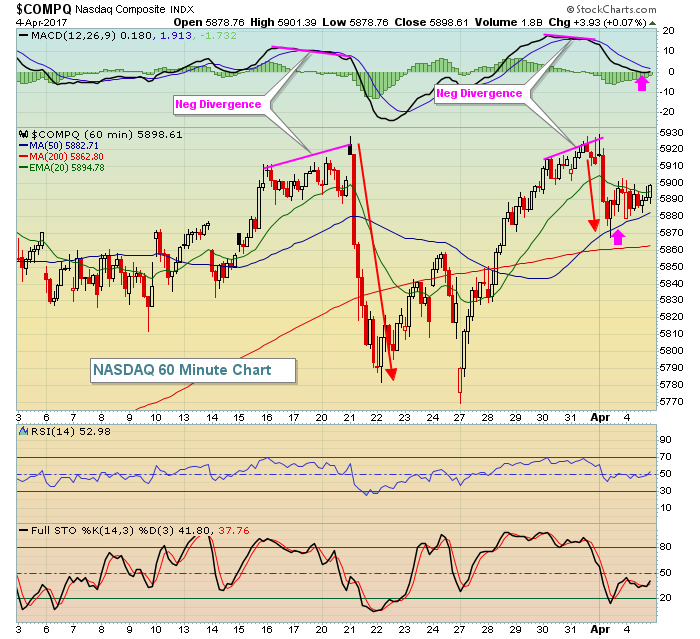 Don't think of these negative divergences as guarantees. Simply think of them as warning flags. The risks of being on the long side of the NASDAQ increase, in my opinion, as prices rise and MACDs fail to follow suit. Because this is an hourly chart, the potential downside action is typically brief - maybe 1 to 3 days as MACD resets and 50 period SMA tests follow (pink arrows).
Sector/Industry Watch
The Dow Jones U.S. Apparel Retailers Index ($DJUSRA) fell 2.6% on Tuesday, closing below the lows established in both November and January. This is obviously not a healthy group and really needs to turn quickly or face more technical selling. Take a look:
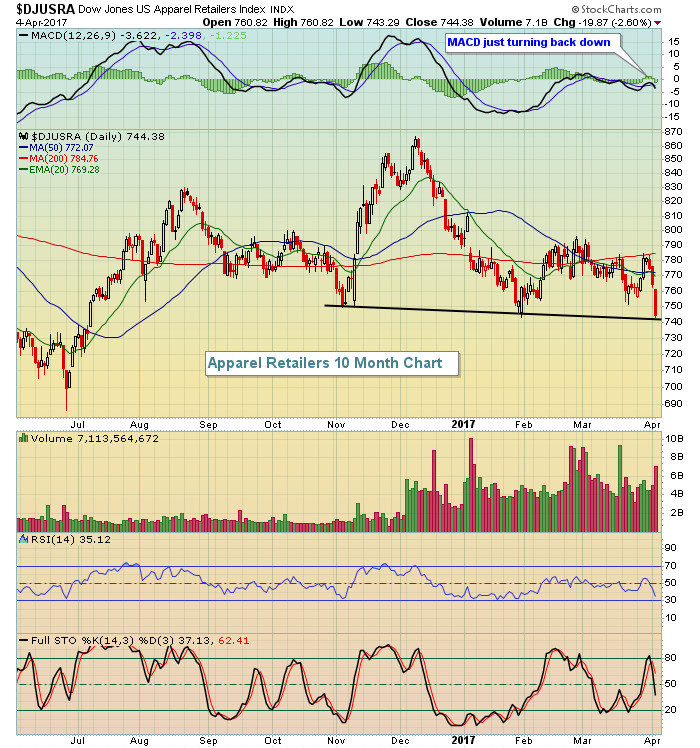 It appears to be a topping head & shoulders pattern, but if you look at a weekly chart on the DJUSRA (not shown), there's been very little uptrend so I'm not sure this pattern applies. Call it what you want, but it doesn't look very good.
Historical Tendencies
This is not something I'd put a lot of "stock" in, but April 5th is one of the best days of the year on the Russell 2000. It's produced annualized returns of 183.85% since 1987, but keep in mind there's a sample size of 19 trading days in this calculation - not exactly representative.
Key Earnings Reports
(actual vs. estimate):
PTR: .83 vs 60
WBA: 1.36 vs 1.36
MON: 3.19 vs 2.76
(reports after close, estimate provided):
BBBY: 1.77
Key Economic Reports
March ADP employment report released at 8:15am EST: 263,000 (actual) vs. 170,000 (estimate)
March ISM non-manufacturing index to be released at 10:00am EST: 57.0 (estimate)
FOMC minutes to be released at 2pm EST
Happy trading!
Tom


