Market Recap for April 5, 2017
The release of the FOMC minutes was widely anticipated to see if there were any hidden nuggets of information from the last Fed meeting. Traders apparently were not happy that the Fed is discussing an unwinding of its balance sheet earlier than expected. That piece of information was primarily responsible for a very significant reversal in our major indices - one of the largest reversals in the past year. The Dow Jones was sailing along, up nearly 200 points in the first hour of trading and wasn't far from its all-time high. Then 2pm hit and all those gains were lost and the Dow Jones finished down 41 points on the session. Check it out:
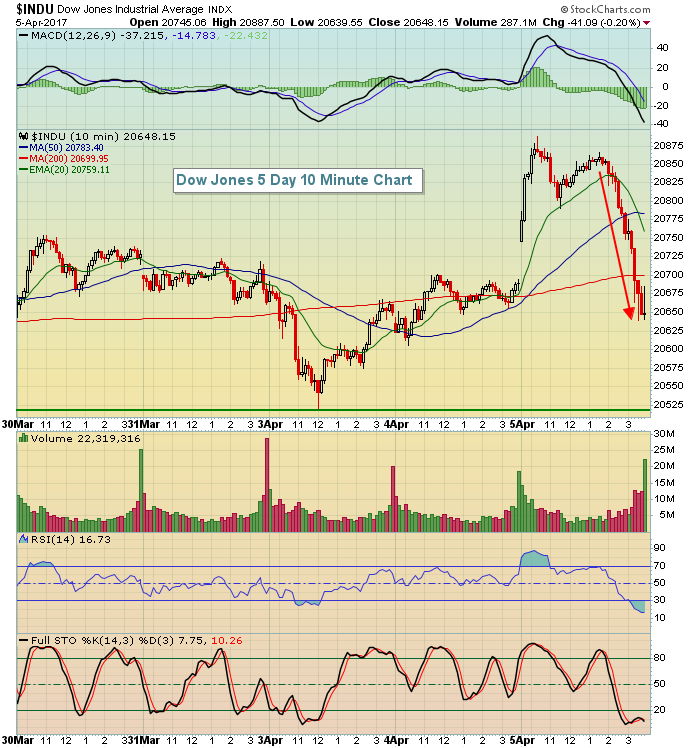 In the very near-term, yesterday's high just below 20900 becomes an important level to clear. To the downside the low from Monday - at about 20520 - will be important to hold.
The selling was felt the worst in the financial sector (XLF, -0.76%) as banks ($DJUSBK) and life insurance ($DJUSIL) were among the worst performers. Recently, we've seen a death cross (20 day drops below the 50 day) on both industry groups and yesterday marked a failure for banks at their now-declining 20 day EMA. Check it out:
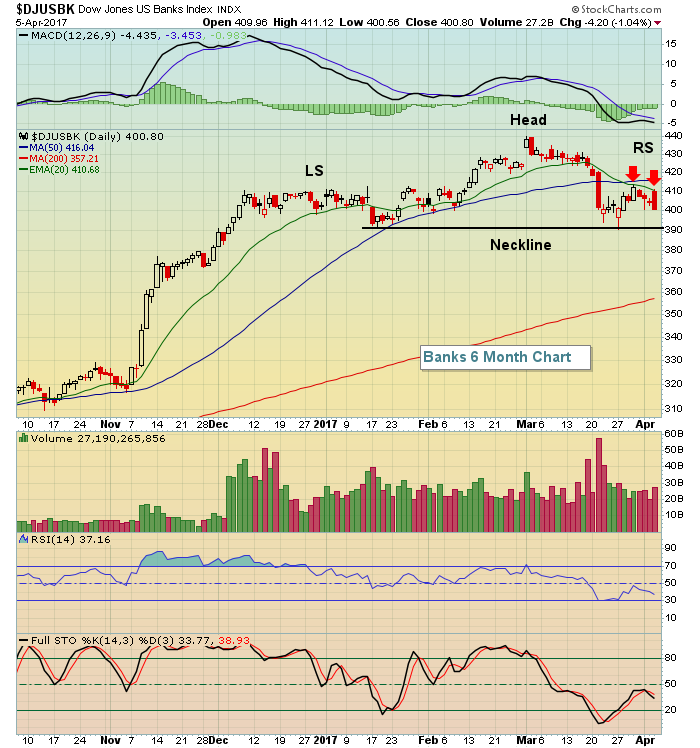 This represents a "potential" topping head & shoulders pattern that would be confirmed by a heavy volume close beneath 390. The failure at the declining 20 day EMA now sets up the trading range between 390 neckline support and the 20 day EMA, currently at 410. There's a battle brewing. The bears clearly want a 10 year treasury yield ($TNX) beneath 2.30% while the bulls desperately want to hold that yield support.
There's a visual on the treasury yield below in the Sector/Industry Watch section.
Pre-Market Action
Initial jobless claims were reported better than expected this morning and Dow Jones futures are slightly higher with nearly an hour to go before the U.S. stock market opens. After the selloff late on Wednesday, most traders are likely happy to see any kind of green today.
The 10 year treasury yield ($TNX) is down 1 basis point to 2.34% this morning as that key 2.30% yield support level approaches.
Current Outlook
The German DAX is climbing closer and closer to an all-time high breakout and correlation between Germany's DAX and the benchmark S&P 500 here is quite strong. So keep an eye on the DAX as a breakout would be one more check mark in the bulls' column. Take a look at the current technical picture of the DAX and especially look at the correlation, which many times is at or near 1 - an indication of VERY strong correlation:
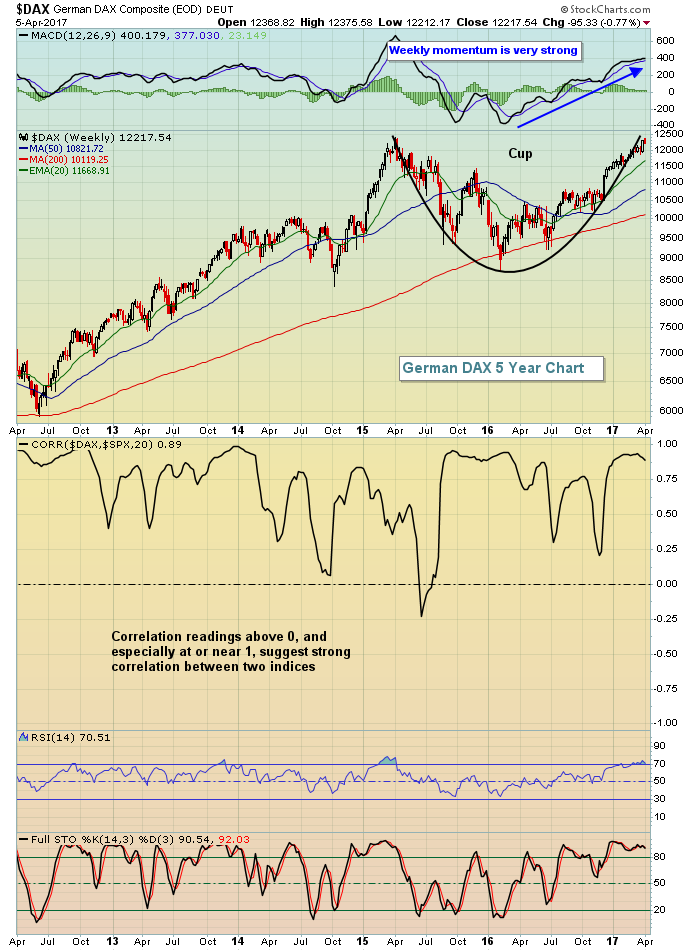 The DAX appears to be in the late stages of forming the right side of a very bullish cup with handle continuation pattern. I'm expecting to see a breakout here at some point during 2017 and that development should be very bullish for U.S. stocks as well. That, combined with a very bullish breakout in the London Financial Times Index ($FTSE), is telling me that the current global bull market remains in full force.
Sector/Industry Watch
The afternoon selloff in equities was blamed primarily on the FOMC minutes that were released at 2pm EST yesterday. The only issue I have with that is that the 10 year treasury yield ($TNX) remained well above its key 2.30% yield support. If the market were truly concerned about Fed policies, I'd expect the TNX to behave differently and potentially break down. But it didn't happen as you can see below:
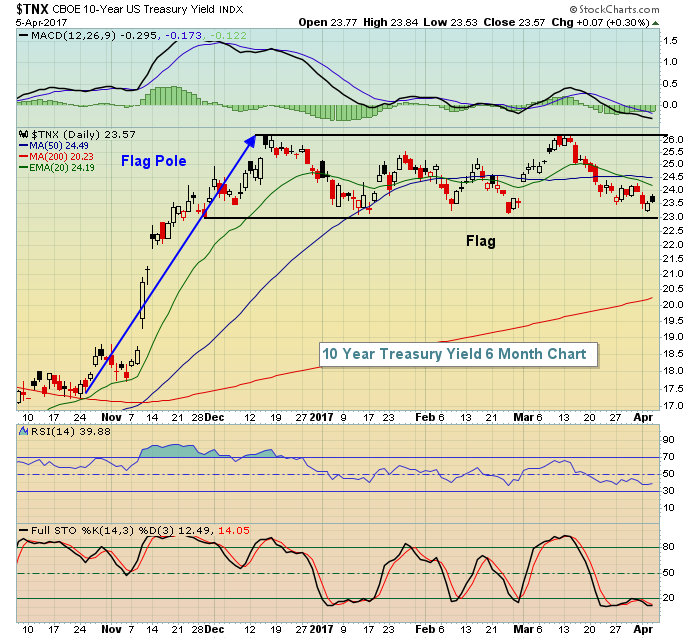 The TNX was actually higher yesterday, although the yield did drop in the afternoon along with equity prices. Still, this is a very bullish flag pattern that I expect will ultimately break to the upside - until the market proves me wrong.
Historical Tendencies
I spend a lot of time discussing many of the best performing sectors, industry groups and stocks during various times of the year, so today I'll focus on one of the worst performing NASDAQ 100 stocks in spring and summer. It's Autodesk (ADSK). Check out the historical performance of ADSK over the past two decades:
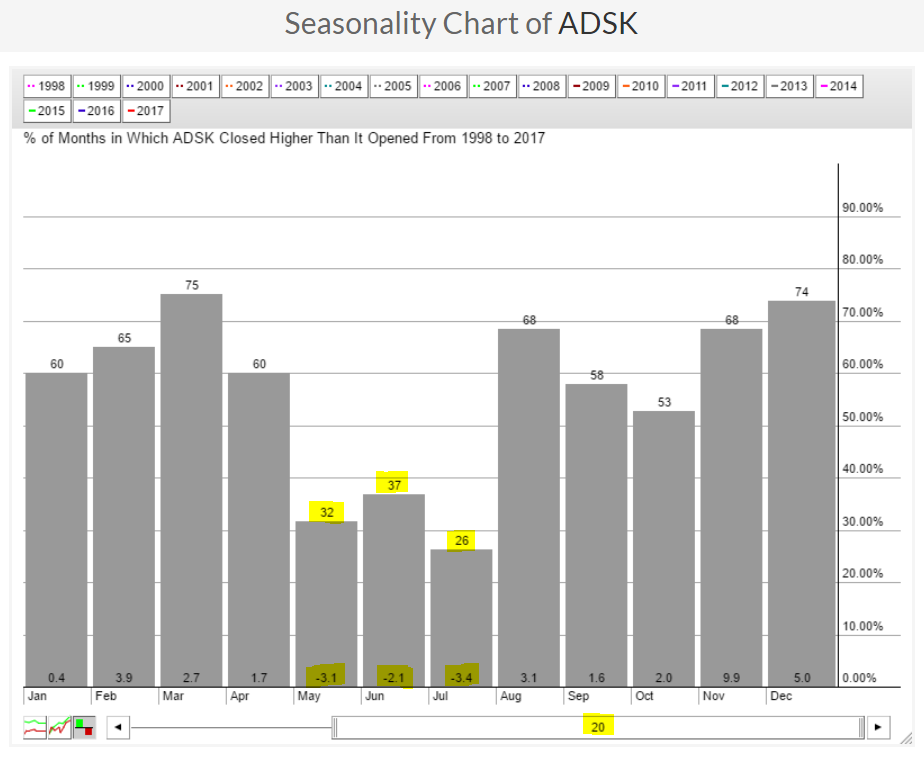 ADSK's three worst months of the year are clearly May, June and July. The technical picture on ADSK isn't bad right now, but it'll be worth monitoring closely over the next few weeks as its weekly MACD has turned lower and another high could produce a negative divergence, leading to underperformance the next few months - fitting in perfectly with historical trends for the stock.
Key Earnings Reports
(actual vs. estimate):
KMX: .81 vs .79
MSM: .93 vs .90
RPM: .14 vs .11
STZ: 1.48 vs 1.37
Key Economic Reports
Initial jobless claims released at 8:30am EST: 234,000 (actual) vs. 250,000 (estimate)
Happy trading!
Tom


