Market Recap for Thursday, April 6, 2017
Yesterday, we saw better relative action on the Russell 2000, a positive for equities. However, that has not been the case over the past week as you can see from the chart below:
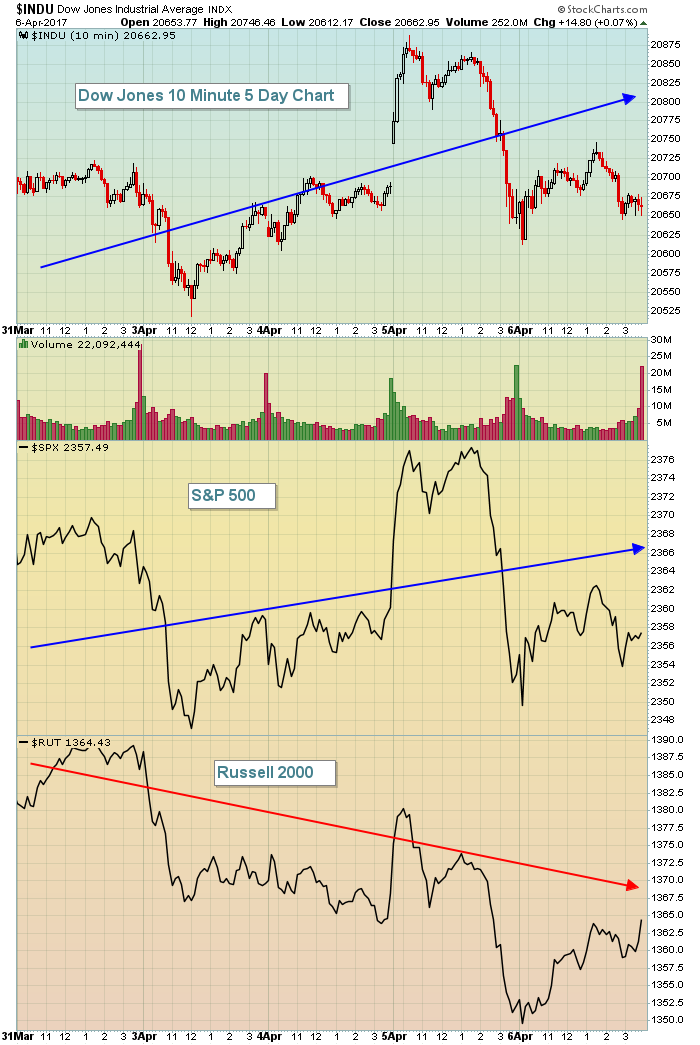 There's been a slight uptrend in Dow stocks - and S&P 500 stocks as well - but the small cap Russell 2000 index has been faltering. Now this morning, we've received bad news in terms of jobs with the March nonfarm payroll report much weaker than expected and the 10 year treasury yield ($TNX) on the verge of a breakdown beneath 2.30% yield support. Today will be an interesting day technically. Can we tack on gains after the strength on Thursday? It doesn't appear we'll start that way, so action intraday will be important.
Financials (XLF, +0.64%) were among the leaders on Thursday, but that will likely change if the TNX breaks down. Here's an XLF chart that's worth watching today:
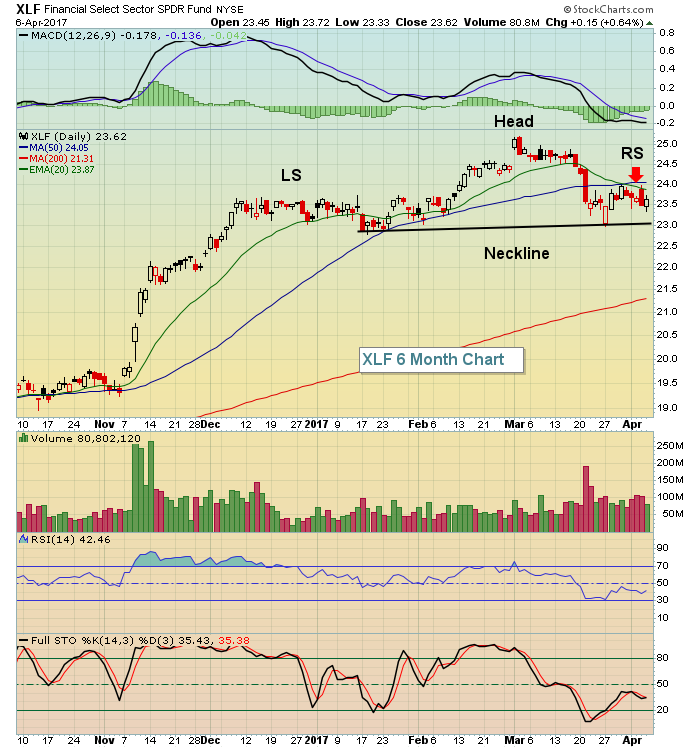 That red arrow marks failure at the declining 20 day EMA and a potential right shoulder in a bearish head & shoulders pattern. As someone that remains on the bullish side of the market (for now), I'd like to see the XLF perhaps print a reversing candle somewhere near price support at 23.00 to mark a bottom. A heavy volume close beneath 23.00 would be very suspect in terms of the sustainability of the current bull market.
Pre-Market Action
The March employment report was released just a few minutes ago and there's clearly disappointment in the weaker-than-expected jobs report. That has sent the 10 year treasury yield ($TNX) lower to challenge very key intermediate-term yield support near the 2.30% level. At last check, the TNX was at 2.30%.
Dow Jones futures have fallen and are now down 53 points with 45 minutes left to the opening bell. That was after futures held up well following U.S. airstrikes overnight in Syria.
Current Outlook
Small cap stocks ($RUT) continue to sideways meander in a trading range from 1335-1392, awaiting a definitive break in one direction or the other. Check this out:
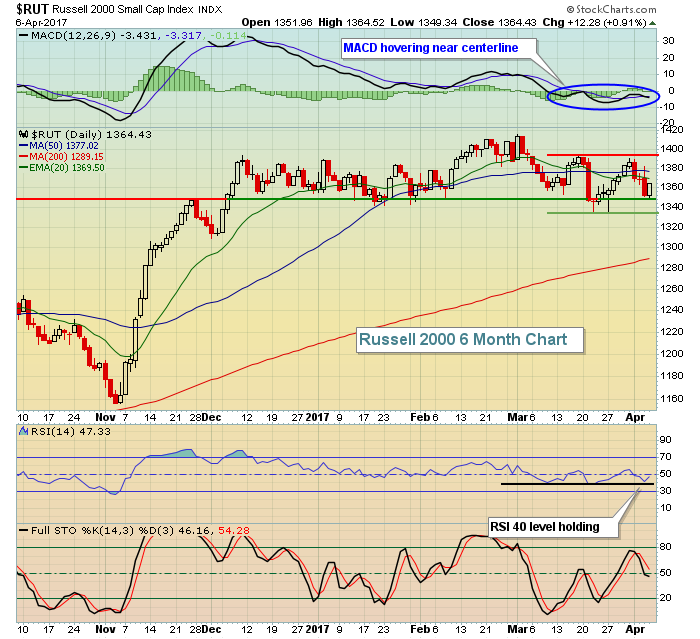 The short-term support/resistance is marked with green and red lines over the past four weeks. Note that RSI 40 continues to hold, suggesting we're still in an uptrend. However, the flat MACD tells us the short-term consolidation continues. Let's see which way this breaks.
Sector/Industry Watch
Can things get any worse for the electronic office equipment ($DJUSOE) space? It's been an awful downward spiral for nearly three years and if historical tendencies are any indication of what to expect, the group won't be happy for the next several months. You can see the seasonal history in the Historical Tendencies section below. Here's the technical view:
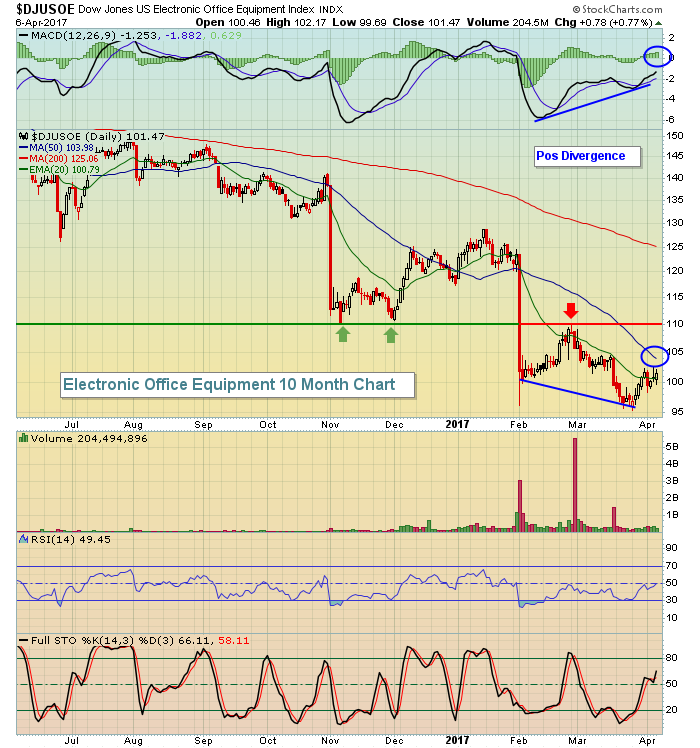 While the positive divergence above could provide a longer-term buy signal, there's still much work from a price/volume perspective to confirm that. Many times positive divergences simply signal a temporary pause from the prior downtrend before resuming it again after a short-term advance. The blue circles above highlight what I look for in terms of price recovery (50 day SMA) and MACD resolution (centerline test). Getting there would not be a surprise at all and even another test of price resistance closer to 110 is certainly possible, but until proven otherwise, I expect the next major longer-term move to be lower.
Historical Tendencies
The seasonal pattern for the DJUSOE is weak through October and that could provide headwinds at a time when the longer-term trend for the industry group remains lower. Here's the historical performance by calendar month:
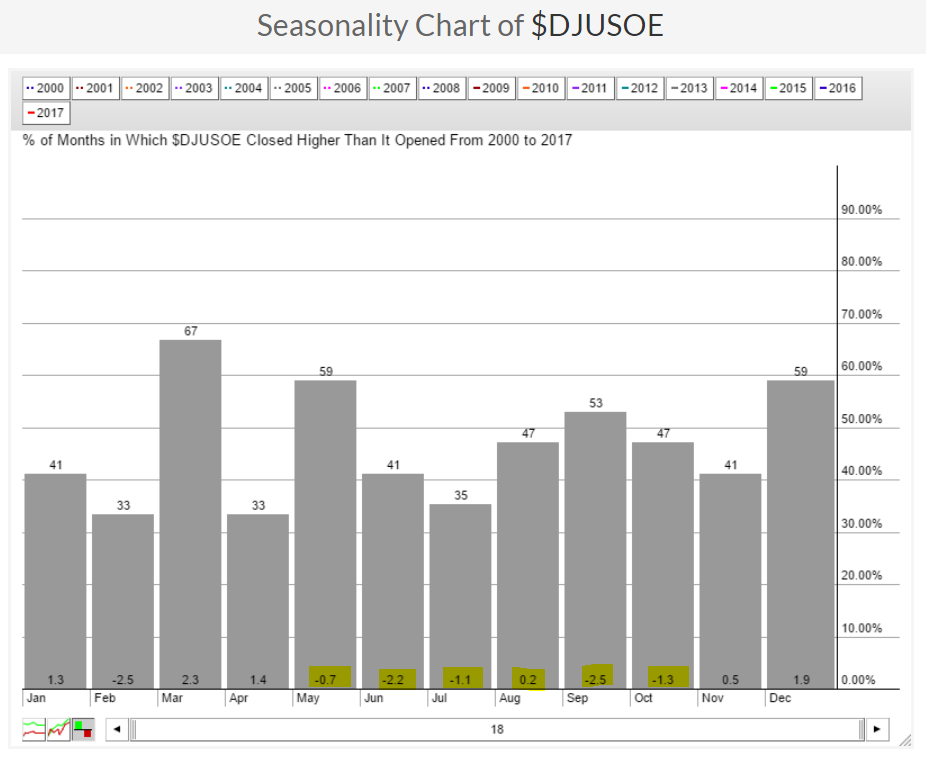 August is the only month over the next six that has produced positive average monthly returns over the past 18 years. So if traders are waiting for bullish seasonal trends to kick in, they'll be waiting awhile.
Key Earnings Reports
None
Key Economic Reports
March nonfarm payrolls released at 8:30am EST: 98,000 (actual) vs. 175,000 (estimate)
March nonfarm private payrolls released at 8:30am EST: 89,000 (actual) vs. 170,000 (estimate)
March unemployment rate released at 8:30am EST: 4.5% (actual) vs. 4.7% (estimate)
March average hourly earnings released at 8:30am EST: +0.2% (actual) vs. +0.3% (estimate)
February wholesale trade to be released at 10:00am EST: +0.4% (estimate)
Happy trading!
Tom


